Overview
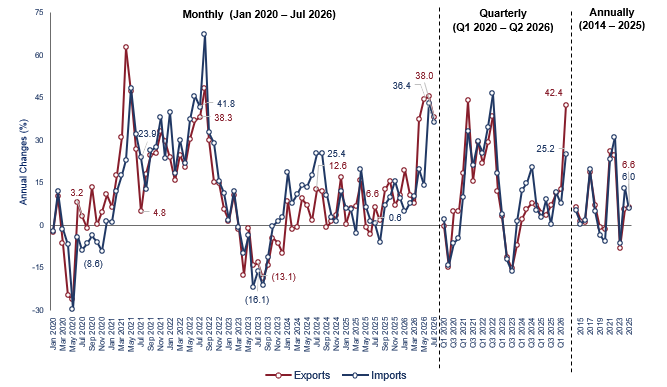
Malaysia's trade performance sustained a positive trend in July 2026, consistent with the double digit rise in export (+38.0%) and imports (+36.4%), year-on-year (y-o-y). Total trade increased by 37.3 per cent or RM99.0 billion, reached RM364.7 billion. Furthermore, trade balance rose by 51.9 per cent or RM7.7 billion from RM14.8 billion to RM22.5 billion as compared to the same period in the previous year. The monthly comparison shows that exports, imports, total trade and trade surplus increased by 8.8 per cent, 5.5 per cent, 7.3 per cent and 42.4 per cent respectively. Total trade, exports, imports and trade surplus all showed positive trends from January to July 2026. Total trade rose by 24.7 per cent to RM2.2 trillion, driven by increases in exports (+29.2%) and imports (+19.8%). In addition, trade surplus escalated by 138.7 per cent to RM170.5 billion.
Chart 1: Trade Performance: Monthly, Quarterly & Annually
Performance of Exports
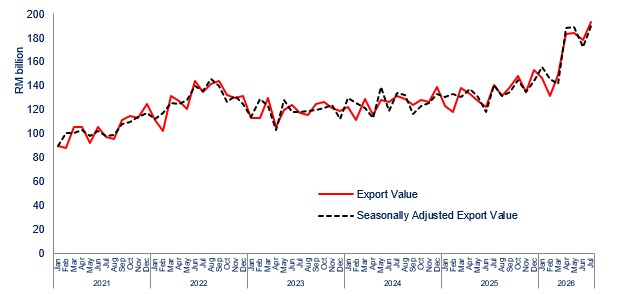
Malaysia’s exports surged by 38.0 per cent y-o-y to RM193.6 billion in July 2026. The positive export growth was mainly contributed by increases in domestic exports and re-exports. Domestic exports valued at RM141.3 billion (73.0% of total exports), increased by 36.9 per cent or RM38.1 billion. Re-exports (27.0% of total exports) registered a growth of 41.2 per cent or RM15.2 billion from RM37.0 billion to RM52.3 billion. Concurrently, monthly comparison showed exports up by 8.8 per cent or RM15.7 billion from RM177.9 billion to RM193.6 billion. Based on month-on-month (m-o-m) seasonally adjusted terms analysis, exports up by 9.8 per cent to RM189.6 billion.
Chart 2: Domestic Exports, Re-Exports (RM billion) and Annual Change (%)
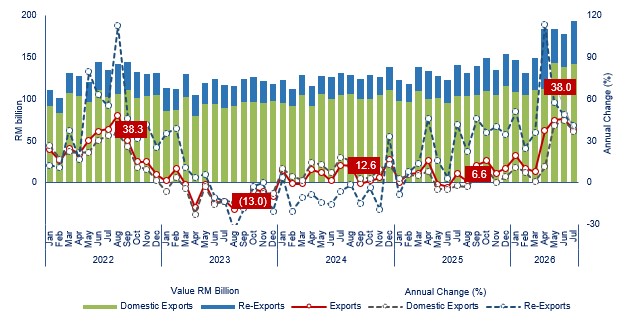
Chart 3: Actual Export Value and Seasonally Adjusted Export Value, RM billion
Performance of Imports
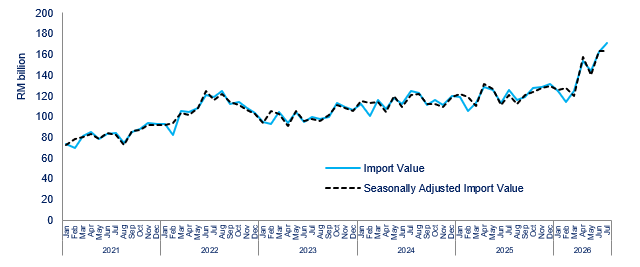
Imports recorded double-digit growth of 36.4 per cent or RM45.7 billion, rising from RM125.5 billion to RM171.1 billion in July 2026. On a m-o-m basis, imports up by 5.5 per cent or RM9.0 billion. According to the m-o-m seasonally adjusted terms analysis, imports increased marginally by 0.1 per cent to RM163.2 billion. Imports by End Use increased, y-o-y, with an increase in intermediate goods (+40.8%), capital goods (+24.0%) and consumption goods (+5.2%).
Chart 4: Imports Value (RM billion) and Annual Change (%)
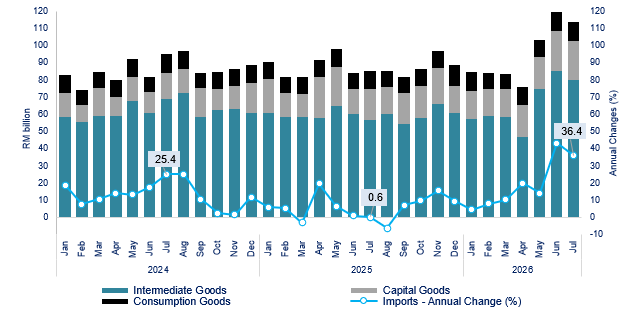
Chart 5: Actual Import Value and Seasonally Adjusted Imports Value, RM billion
For interviews, press statement and clarification to the media, contact:
Baharudin Mohamad
Public Relation Officer
Email: baharudin[at]dosm.gov.my
Phone: 03 8090 4681
Not found what you looking for? Request data from us, through
Go to eStatistik
Email: data[at]dosm.gov.my
Phone: 03 8885 7128 (data request)