
Micro, Small & Medium Enterprises (MSMEs) Performance
- Home
- Statistics
- Economy
- National Accounts
- Micro, Small & Medium Enterprises (MSMEs) Performance
Small and Medium Enterprises Gross Domestic Product (SMEs GDP) 2016
Overview
PERFORMANCE OF SMEs GDP
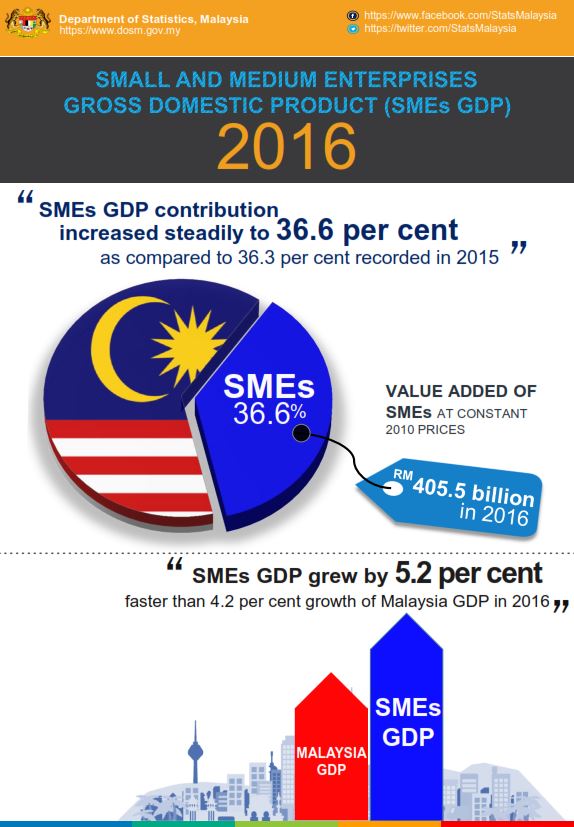
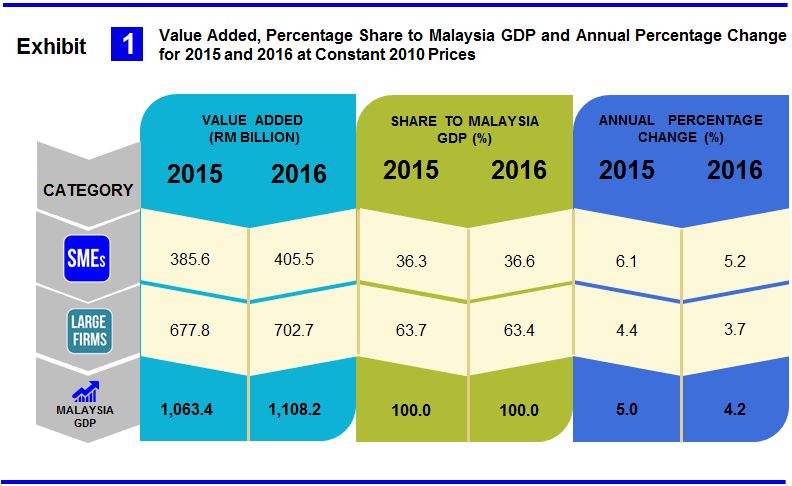
The performance of SMEs GDP outpaced the Malaysia GDP in 2016 with a growth of 5.2 per cent compared to Malaysia GDP which stood at 4.2 per cent as shown in Exhibit 1. This reflects the importance of SMEs in gearing up the nation’s economy. The contribution of SMEs GDP to the Malaysia GDP has increased steadily to 36.6 per cent from 36.3 per cent recorded in preceding year.
In 2016, value added of SMEs at constant 2010 prices was RM405.5 billion (2015: RM385.6 billion). In nominal terms, SMEs GDP registered a value of RM463.2 billion, an increment of RM34.2 billion compared to 2015.
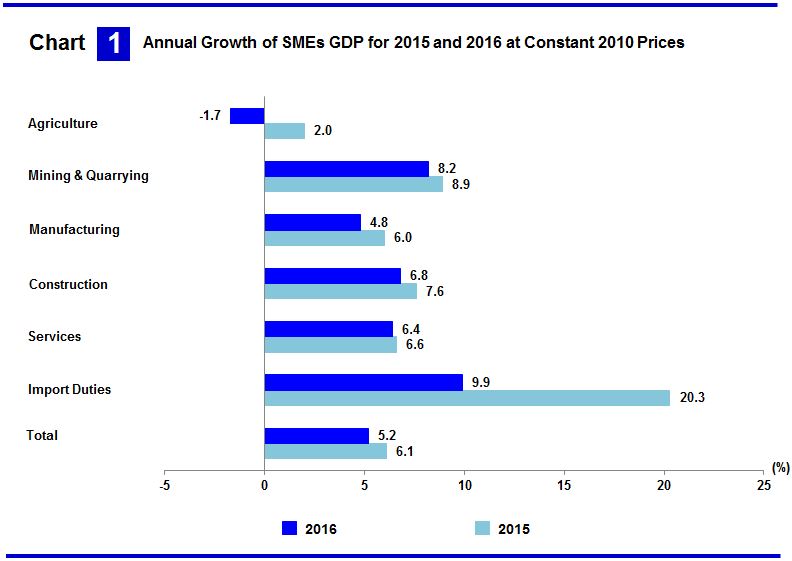
SMEs value added for Services sector (Chart 1) registered a growth of 6.4 per cent as compared 6.6 per cent in 2015. The growth momentum was supported by Finance, Insurance, Real Estate and Business Services sub-sector which registered a better growth of 5.9 per cent (2015: 5.5%) driven mainly by Insurance and Business Services segments. On the same note, Wholesale & Retail Trade, Food & Beverages and Accommodation sub-sector grew to 6.8 per cent (2015: 7.0%) attributed by Wholesale and Motor Vehicles segments. Transportation & Storage and Information & Communication sub-sector moderated to 5.8 per cent (2015: 6.6%).
In Manufacturing sector, value added of SMEs recorded a growth of 4.8 per cent (2015: 6.0%) led by Food, Beverages and Tobacco sub-sector which increased 2.8 per cent (2015: 2.6%). Meanwhile, Petroleum, Chemical, Rubber & Plastic Products moderated to 5.4 per cent (2015: 6.1%) due to Chemicals and Rubber products. Furthermore, Non-Metallic Mineral Products, Basic Metal & Fabricated Metal Products registered at 6.2 per cent from 7.5 per cent in 2015.
Value added of SMEs in Construction sector grew to 6.8 per cent (2015: 7.6%) underpinned by Specialised Construction Activities and Civil Engineering sub-sectors. Nevertheless, contraction in Non-Residential Buildings sub-sector has influenced overall performance in this sector. In addition, value added of SMEs in Mining & Quarrying sector recorded a growth of 8.2 per cent from 8.9 per cent in 2015.
In Agriculture sector, value added of SMEs declined 1.7 per cent as compared to 2.0 per cent in the previous year. This was attributed by Rubber, Oil Palm, Livestock & Other Agriculture sub-sector which contracted to 2.4 per cent (2015: 3.0%) following a decrease in production of rubber and oil palm. Nonetheless, Fishing and Forestry & Logging sub-sectors posted a better momentum as compared to the preceding year.
COMPOSITION BY KIND OF ECONOMIC ACTIVITY
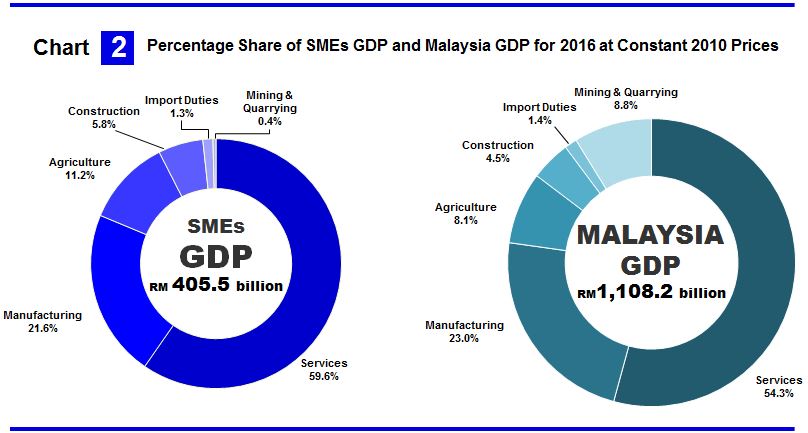
Services and Manufacturing sectors maintained its stronghold as the prominent economic activities in Malaysia for both SMEs GDP and Malaysia GDP. The combined share from the two sectors represented more than 70 per cent of the economy as depicted in Chart 2. Agriculture sector was the third largest contributor for SMEs GDP with a share of 11.2 per cent instead of Mining & Quarrying sector for Malaysia GDP.
CONTRIBUTION OF SMEs GDP BY KIND OF ECONOMIC ACTIVITY
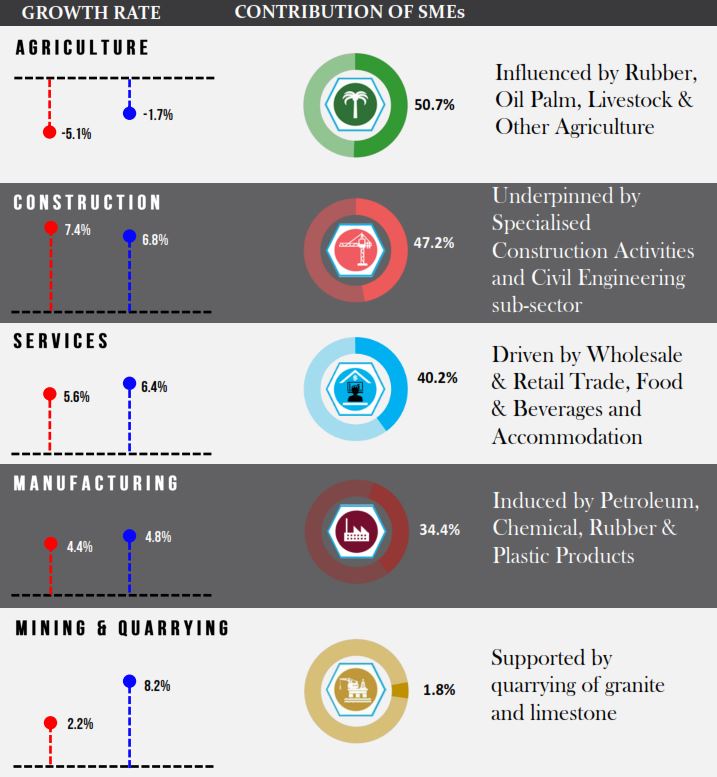
In 2016, all sectors registered a higher contribution of SMEs value added with the exception of Construction sector. SMEs GDP led the Agriculture sector with a share of 50.7 per cent, an increment of 1.7 per cent from 2015 as portrayed in Chart 3. This was spurred by Rubber, Oil Palm, Livestock and Other Agriculture sub-sector especially in Oil Palm segment.
The contribution of SMEs GDP in Construction sector reduced marginally to 47.2 per cent from 47.5 per cent in preceding year reflected by the lower contribution by all sub-sectors except Specialised Construction Activities.
SMEs GDP share of Services sector expanded further 40.2 per cent as compared to 39.9 per cent in 2015. The contribution was dominated by Finance, Insurance, Real Estate and Business Services sub-sector impelled by Business Services segment. Furthermore, Wholesale & Retail Trade, Food & Beverages and Accommodation sub-sector also supported this sector particularly in Retail and Motor Vehicles segments.
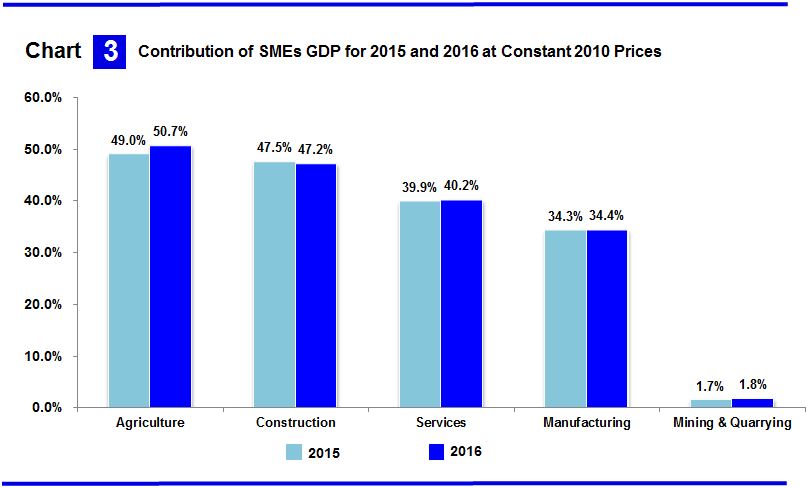
The share of SMEs value added for Manufacturing sector increased slightly to register 34.4 per cent (2015: 34.3%) attributed by Petroleum, Chemical, Rubber and Plastic Products. Subsequently, Non-Metallic Mineral Products, Basic Metal and Fabricated Metal Products also contributed towards the increment of SMEs GDP contribution in this sector.
In addition, the SMEs GDP in Mining & Quarrying sector recorded a share of 1.8 per cent mainly in quarrying of granite and limestone.
Released By:
THE OFFICE OF CHIEF STATISTICIAN MALAYSIA
DEPARTMENT OF STATISTICS, MALAYSIA
21 September 2017
Contact person:
Ho Mei Kei
Public Relation Officer
Corporate and User Services Division
Department of Statistics, Malaysia
Tel : +603-8885 7942
Fax : +603-8888 9248
Email : mkho[at]stats.gov.my
Subscribe
Newsletter
Subscribe to our newsletter and stay updated
For interviews, press statement and clarification to the media, contact:
Baharudin Mohamad
Public Relation Officer
Email: baharudin[at]dosm.gov.my
Phone: 03 8090 4681
Not found what you looking for? Request data from us, through
Go to eStatistik
Email: data[at]dosm.gov.my
Phone: 03 8885 7128 (data request)


