PERFORMANCE OF SMEs GDP
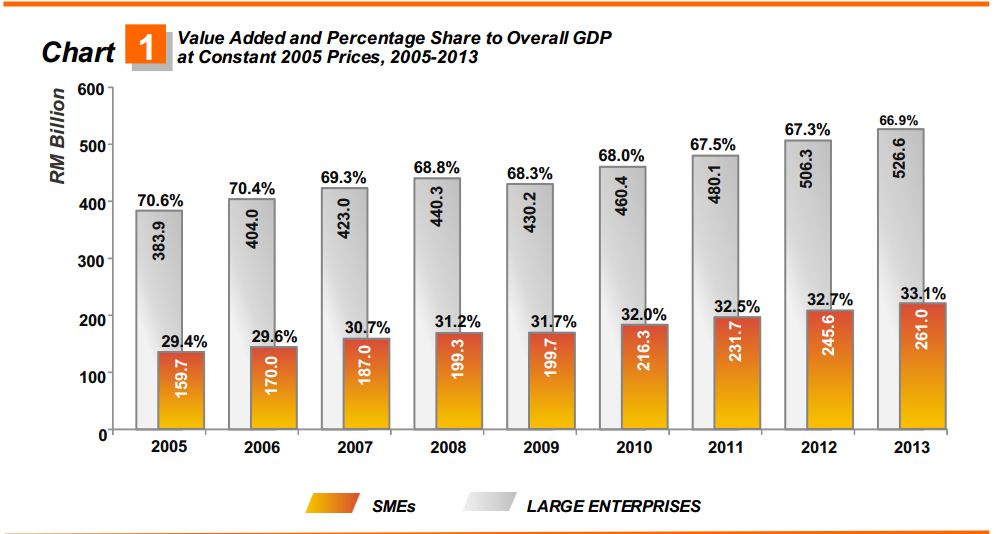
The contribution of SMEs GDP to Malaysia’s economy expanded to 33.1 per cent (Chart 1), an increase of 0.5 per cent from year 2012. Value added of SMEs at constant 2005 prices was RM261.0 billion in 2013 as compared to RM245.6 billion in the preceding year. In current prices, SMEs registered a value added of
RM325.9 billion (2012: RM305.0 billion).
 ANNUAL GROWTH
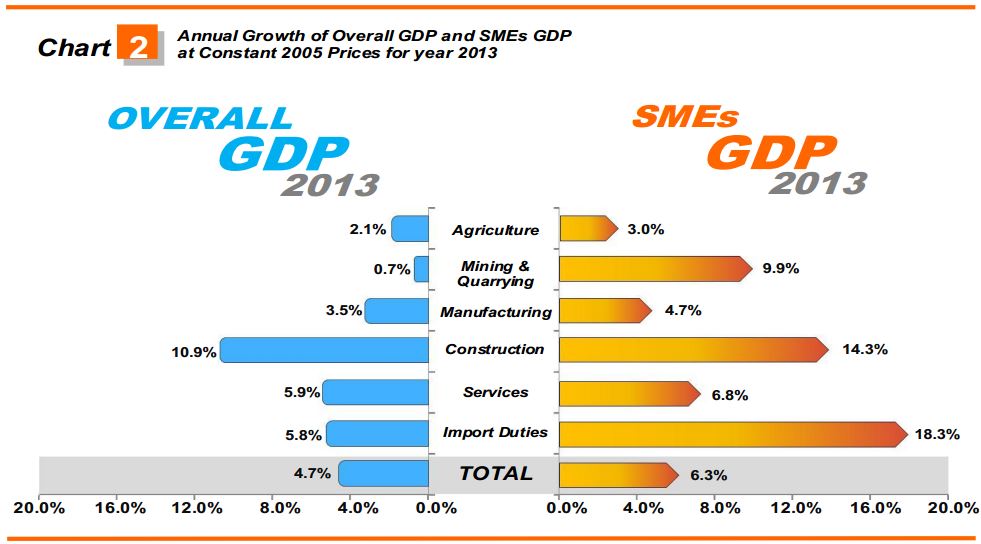
In 2013, the growth of SMEs GDP strengthened to 6.3 per cent as compared to the growth of Overall GDP at 4.7 per cent as shown in Chart 2. The growth of SMEs GDP was supported by positive momentum across all sectors with Services, Manufacturing and Construction being the major contributors. These sectors accounted for 88.8 per cent to total SMEs GDP.
Services sector led the strong performance in SMEs GDP by posting a growth of 6.8 per cent as against 5.9 per cent recorded in Overall GDP. The Wholesale & retail trade and accommodation & restaurants sub-sector has consistently remained as the prime mover in stimulating the SMEs GDP.
Value added of SMEs for Manufacturing sector grew 4.7 per cent, a faster pace than 3.5 per cent registered in Overall GDP. The growth was underpinned by Petroleum, chemical, rubber & plastic products largely in products related to plastics. Furthermore, Food, beverages and tobacco showed a favourable performance which was impelled by manufacture of bread, cake, cookies and non-alcoholic beverages.
Value added of SMEs in Construction sector remained robust with a growth of 14.3 per cent, relatively higher than the 10.9 per cent posted in Overall GDP. Civil engineering and Special trade influenced the growth of this sector.
 DISTRIBUTION BY KIND OF ECONOMIC ACTIVITY
The structure of Malaysia’s economy is highly concentrated in Services, followed by Manufacturing and Mining & Quarrying sectors (Chart 3). From SMEs GDP perspective, the distribution was led by the Services (62.1 per cent) and Manufacturing (23.7 per cent), replicating the nation’s economic structure. Following the distinct characteristics observed in SMEs, Agriculture (9.7 per cent) was the third largest contributor and the remaining sectors constituted 3.2 per cent of share to the SMEs GDP.
 CONTRIBUTION BY KIND OF ECONOMIC ACTIVITY
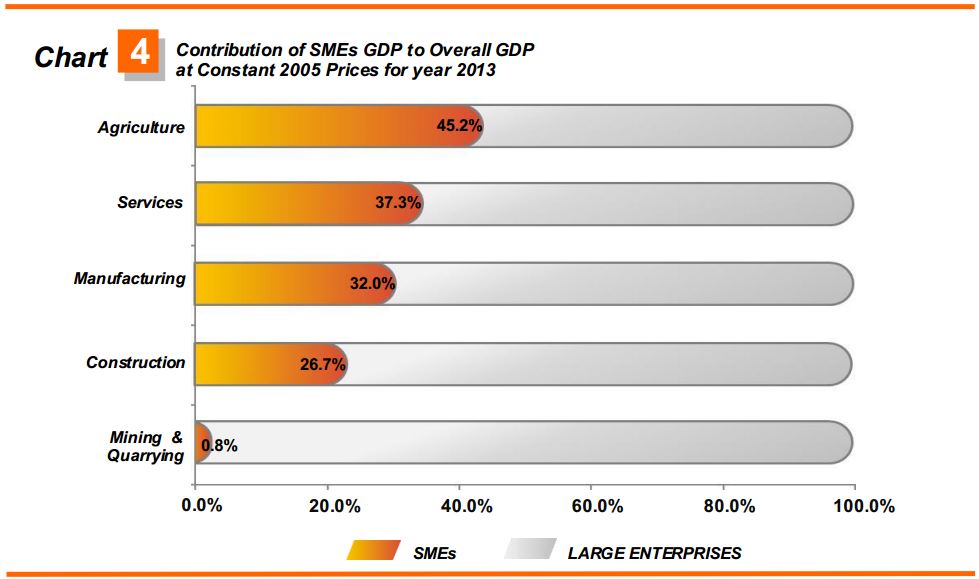
SMEs activities are prevalent in Agriculture, Services and Manufacturing sectors. SMEs value added for Agriculture sector registered a major share of 45.2 per cent (Chart 4). The SMEs were profoundly reflected in Rubber, oil palm, livestock and other agriculture sub-sector. Fishing found its share in the SMEs and largely led by marine fisheries.
Value added of SMEs contributed a vital share of 37.3 per cent in Services sector which was largely concentrated in Wholesale & retail trade and accommodation & restaurants. Finance, insurance, real estate and business services also bolstered this sector significantly particularly in professional services.
The share of SMEs value added for Manufacturing sector was 32.0 per cent, contributed substantially by Petroleum, chemical, rubber and plastic products. In addition, SMEs activities were also prominent in Food, beverages and tobacco and Non-metallic mineral products, basic metal and fabricated metal products.
In 2013, value added of SMEs for Construction sector contributed 26.7 per cent whereby Special trade and Civil engineering were the catalyst of this sector. Nevertheless, value added of SMEs in Mining & Quarrying sector such as quarrying of granite and limestone contributed a marginal share of 0.8 per cent.