
Producer Price Index
- Home
- Statistics
- Economy
- Prices
- Producer Price Index
Producer Price Index Malaysia December 2021
Producer Price Index Malaysia November 2021 30 November 2021
Producer Price Index Malaysia October 2021 28 October 2021
Producer Price Index Malaysia September 2021 30 September 2021
Producer Price Index Malaysia August 2021 26 August 2021
Producer Price Index Malaysia July 2021 29 July 2021
Producer Price Index Malaysia June 2021 Show all release archives
Overview
PRODUCER PRICE INDEX (2010=100) BY SECTOR (MSIC 2008)
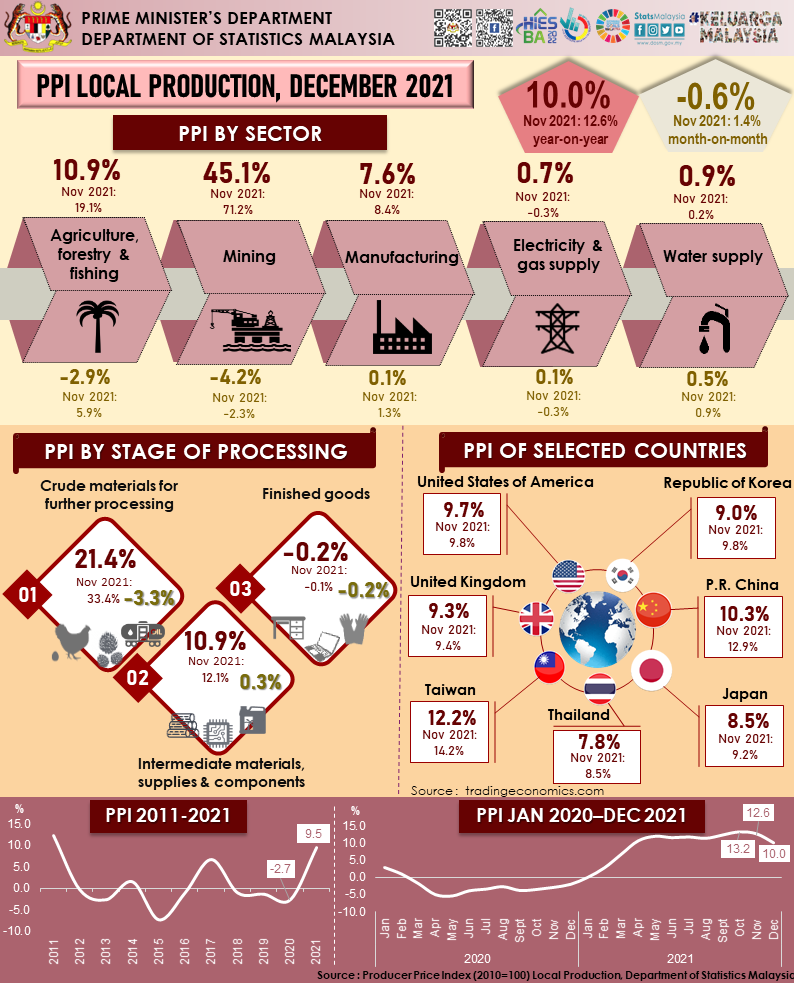
The Producer Price Index (PPI) local production in December 2021 increased 10.0 per cent as opposed to a decrease of 2.1 per cent recorded in the same month of the preceding year. The increase in the PPI local production during the month was attributed by Mining index that rose 45.1 per cent from a slump of 40.0 per cent recorded in December 2020. Higher prices of Crude oil (46.8%) and Natural gas (37.0%) have contributed to the increase. The index of Agriculture, forestry & fishing also increased at a moderate rate of 10.9 per cent (December 2020: 23.5%), largely due to the incline in the indices of Fishing (12.4%), Animal production (11.6%) and Growing of perennial crops (11.2%). Meanwhile, Manufacturing index increased 7.6 per cent as compared to a marginal increase of 0.2 per cent recorded a year ago. The increase was contributed by the indices for subsectors of Manufacture of refined petroleum products (22.3%), Manufacture of vegetable & animal oils & fats (18.1%) and Manufacture of basic chemicals, fertilizers & nitrogen compounds, plastics & synthetic rubber in primary forms (15.6%). In addition, the indices for the subsectors of Manufacture of plastics products, Manufacture of rubber products and Manufacture of basic iron & steel also moved higher. The utilities index recorded a marginal increase of 0.9 per cent and 0.7 per cent for Water supply and Electricity & gas supply indices, respectively.
In terms of month-on-month comparison, the PPI local production declined for the first time after recording a consistent increase for 14 consecutive months. The PPI local production dropped 0.6 per cent in December 2021, with the decline mainly contributed by Mining index that registered a negative 4.2 per cent. Crude oil prices continued to record a decrease due to the spread of Omicron variant and contributed to the addition of COVID-19 positive cases that not only happened in Malaysia, but worldwide. The spread of this new variant caused most countries to reimpose travel restrictions, which ultimately may dent this commodity demand. In addition, the index of Agriculture, forestry & fishing also recorded a decline of 2.9 per cent, driven mainly by the price of Oil palm fresh fruit bunches which fell 4.9 per cent from November 2021. Price for Chicken also showed a 0.8 per cent decline. Meanwhile, Manufacturing index increased marginally 0.1 per cent, supported by a modest increase of 0.7 per cent for Manufacture of refined petroleum products subsector besides rising prices for construction-related products. However, the marginal increase in Manufacturing index was also offset by a drop of 0.8 per cent for Manufacture of electronic components & boards. Similarly, the indices of Water supply and Electricity & gas supply rose 0.5 per cent and 0.1 per cent respectively.
Table 1 : Producer Price Index (2010=100) Local Production by Sector (MSIC 2008), Malaysia

PRODUCER PRICE INDEX BY STAGE OF PROCESSING
The index of Crude materials for further processing increased 21.4 per cent as opposed to a decrease of 10.0 per cent recorded in the same month of the previous year. The increase was mainly attributed by higher prices of non-food commodities such as Crude oil, Oil palm fresh fruit bunches and Other diesel fuel. The index of Foodstuffs & feedstuffs namely Black pepper, Chicken, Round cabbage, Tomato and Chicken egg also increased. Similarly, the index of Intermediate materials, supplies & components rose 10.9 per cent. Among the products that contributed to the increase were Crude palm oil, Integrated Circuits, Aluminium, Mild Steel Round Bars and Mixed poultry feeds. However, the index of Finished goods recorded a decline of 0.2 per cent due to a decrease in the indices of Personal computers and Rubber gloves (Examination).
For a monthly comparison, the index of Crude materials for further processing recorded a decrease of 3.3 per cent as compared to an increase of 2.3 per cent recorded in the previous month underpinned by falling prices for primary commodities. The index of Intermediate materials, supplies & components increased slightly by 0.3 per cent, supported by the increase in the indices of Processed fuel & lubricants (1.0%) and Materials & components for manufacturing (0.3%). The index of Finished goods fell 0.2 per cent.
Table 2: Producer Price Index (PPI) Local Production by Stage of Processing, Malaysia

PPI LOCAL PRODUCTION, FOURTH QUARTER OF 2021
The PPI local production in the fourth quarter of 2021 remained in an upward trend with a new double-digit increase of 11.9 per cent as compared to a decrease of 2.9 per cent recorded in the same period last year. The increase during the quarter was underpinned mainly by the indices of Mining (65.4%) and Agriculture, forestry & fishing (17.9%). The Manufacturing index also increased 7.9 per cent as opposed to a decline of 0.4 per cent recorded in the same quarter last year. In addition, the indices of Electricity & gas supply as well as Water supply increased 0.3 per cent and 0.2 per cent respectively.
For a quarter-on-quarter comparison, the PPI local production showed an increase of 2.1 per cent than a 1.6 per cent incline recorded in the third quarter of 2021. The increase in the quarter was driven by the increase in the index of Agriculture, forestry & fishing which rose 5.4 per cent as compared to a decrease of 2.6 per cent in the previous quarter. Meanwhile, Mining index rose modestly by 2.5 per cent (Q3 2021: 9.8%) as a result of the decline in Crude oil prices for two consecutive months. The Manufacturing index also rose 1.8 per cent. As for the utilities index, the Water supply index increased 0.8 per cent, however, the Electricity & gas supply index fell 0.1 per cent.
Table 3: Average Index and Percentage Change of Quarterly PPI Local Production by Sector, Malaysia

PPI LOCAL PRODUCTION, 2021
In overall, the PPI local production in 2021 recorded an increase for the first time after recording a decline for three consecutive years. In 2021, the PPI local production increased 9.5 per cent as compared to a decrease of 2.7 per cent recorded in 2020. The increase was driven by Mining index which rose 41.2 per cent as opposed to a fall of 36.3 per cent in 2020. In addition, the increase during this year was also due to an incline of 30.2 per cent in the index of Agriculture, forestry & fishing, as well as a 5.5 per cent increase in the Manufacturing index. Furthermore, for the utilities index, the index of Water supply increased 0.5 per cent. In contrast, the index of Electricity & gas supply dropped 0.4 per cent.
Table 4: Average Index and Percentage Change of PPI Local Production by Sector, Malaysia

The full publication of the Producer Price Index Malaysia, December 2021 can be downloaded from eStatistik portal.
Released by:
DATO' SRI DR. MOHD UZIR MAHIDIN
CHIEF STATISTICIAN MALAYSIA
DEPARTMENT OF STATISTICS, MALAYSIA
![]() DrUzir_Mahidin
DrUzir_Mahidin ![]()
![]() Dr_Uzir
Dr_Uzir
27 January 2022
Contact person:
Mohd Yusrizal Ab Razak
Public Relation Officer
Strategic Communication and International Division
Department of Statistics, Malaysia
Tel : +603-8885 7942
Fax : +603-8888 9248
E-mail : yusrizal.razak[at]dosm.gov.my
Subscribe
Newsletter
Subscribe to our newsletter and stay updated
For interviews, press statement and clarification to the media, contact:
Baharudin Mohamad
Public Relation Officer
Email: baharudin[at]dosm.gov.my
Phone: 03 8090 4681
Not found what you looking for? Request data from us, through
Go to eStatistik
Email: data[at]dosm.gov.my
Phone: 03 8885 7128 (data request)


