
Malaysia External Trade Statistics
- Home
- Statistics
- Economy
- External Sector
- Malaysia External Trade Statistics
Malaysia External Trade Statistics September 2019
Malaysia External Trade Statistics August 2019 4 September 2019
Malaysia External Trade Statistics July 2019 2 August 2019
Malaysia External Trade Statistics Jun 2019 4 July 2019
Malaysia External Trade Statistics May 2019 3 June 2019
Malaysia External Trade Statistics April 2019 3 May 2019
Malaysia External Trade Statistics March 2019 Show all release archives
Overview
\
KEY FACTS
MONTHLY
- In September 2019, exports slipped 6.8% year-on-year (y-o-y) to RM77.7 billion. Re-exports was valued at RM12.7 billion registering a decline of 17.6% y-o-y and accounted for 16.3% of total exports. Domestic exports also declined 2.9% (-RM2.0 billion) to RM65.0 billion.
- Imports expanded 2.4% y-o-y to RM69.4 billion.
- On a month-on-month (m-o-m) basis, exports declined 4.5% or RM3.7 billion from RM81.4 billion. In seasonally adjusted terms, exports declined 3.6%.
- On a m-o-m basis, imports also recorded a decrease of 1.6% or RM1.1 billion from RM70.5 billion. In seasonally adjusted terms, imports dropped marginally 0.02%.
- On a y-o-y basis, exports fell due to the decline in exports to Hong Kong (-RM1.8 billion), Singapore (-RM1.4 billion), the European Union
- (-RM891.7 million), Australia (-RM563.8 million) and China (-RM334.0 million).
- On a y-o-y basis, higher imports were mainly from China (+RM1.3 billion), Republic of Korea (+RM595.5 million), Saudi Arabia (+RM515.8 million), the European Union (+RM428.0 million) and India (+RM377.4 million).
QUARTERLY
- In third quarter 2019, exports fell 1.9% y-o-y to RM247.0 billion. Re-exports was valued at RM44.0 billion decreasing 9.2% y-o-y and accounted for 17.8% of total exports. Domestic exports decreased marginally 0.2% to RM203.0 billion from a year ago.
- Imports also registered a decrease of 5.8% y-o-y to RM213.5 billion.
- On a quarter-on-quarter (q-o-q) basis, exports rose 0.6% from RM245.4 billion.
- However, on a q-o-q basis, imports registered a decrease of 0.7% from RM215.0 billion.
- On a y-o-y basis, the decrease of exports was attributed by lower exports to Hong Kong (-RM2.6 billion), Singapore (-RM1.8 billion), Australia
- (-RM1.8 billion), the European Union (-RM716.6 million) and Thailand (-RM689.3 million). However, exports increased to the United States (+RM1.6 billion), Bangladesh (+RM933.3 million) and Taiwan (+RM797.5 million).
- On a y-o-y basis, lower imports were mainly from Singapore (-RM4.8 billion), Taiwan (-RM3.5 billion), the European Union (-RM1.9 billion), Thailand (-RM1.8 billion) and Switzerland (-RM1.2 billion). However, higher imports were from Republic of Korea (+RM1.3 billion), United Arab Emirates (+RM740.6 million) and Brunei Darussalam (+RM709.7 million).
TRADE
Total trade which was valued at RM147.1 billion decreased RM4.0 billion or 2.7% as compared to September 2018. It also posted a decrease of RM4.7 billion or 3.1% when compared to the previous month. The trade surplus was RM8.3 billion, shrank 46.5% or RM7.2 billion from a year ago. It also dropped 23.5% or RM2.6 billion as compared to the previous month.
EXPORTS
On a y-o-y basis, exports decreased 6.8% from RM83.3 billion. The main products which attributed to the decline were:
- Electrical and electronic (E&E) products (37.4% of total exports), dropped RM4.1 billion (-12.2%) to RM29.0 billion;
- Crude petroleum, which contributed 1.9% to total exports fell RM1.2 billion or 45.8% to RM1.5 billion due to the decrease in both export volume (-38.1%) and average unit value (-12.4%);
- Refined petroleum products, which contributed 6.0% to total exports dropped RM805.1 million or 14.7% to RM4.7 billion due to the decrease in both export volume (-13.4%) and average unit value (-1.4%);
- Palm oil and palm oil-based products (6.7% of total exports), fell RM366.9 million (-6.6%) to RM5.2 billion. Exports of palm oil, the major commodity in this group of products decreased RM313.3 million or 9.3% due to the fall in both average unit value (-7.1%) and export volume (-2.3%);
- Liquefied natural gas (LNG), which accounted for 4.2% of total exports shrank RM61.5 million or 1.8% to RM3.3 billion due to the decline in average unit value (-16.3%) as export volume grew 17.3%; and
- Natural rubber, which contributed 0.4% to total exports, decreased RM14.7 million or 4.8% to RM291.8 million due to the decline in export volume (-8.2%) as average unit value increased 3.7%.
However, timber and timber-based products, which contributed 2.4% to total exports, increased RM101.5 million or 5.8% to RM1.9 billion.
On a m-o-m basis, exports decreased RM3.7 billion (-4.5%) from RM81.4 billion. The main products which attributed to the decline were:
- Palm oil and palm oil-based products, shrank RM702.8 million (-11.9%) from RM5.9 billion. Exports of palm oil, fell RM601.7 million or 16.5% due to the decrease in export volume (-20.8%) as average unit value rose 5.5%;
- E&E products dropped RM622.6 million (-2.1%) from RM29.7 billion;
- Crude petroleum, declined RM507.9 million or 25.8% from RM2.0 billion due to the decrease in both export volume (-24.1%) and average unit value (-2.2%);
- Refined petroleum products declined RM192.6 million or 3.9% from RM4.9 billion due to the decline in export volume (-13.4%) as average unit value rose 10.9%;
- Timber and timber-based products decreased RM154.3 million (-7.6%) from RM2.0 billion; and
- Natural rubber decreased RM57.8 million or 16.5% from RM349.6 million due to the decrease in both export volume (-14.0%) and average unit value (-3.0%).
However, LNG rose RM365.8 million (+12.6%) from RM2.9 billion due to the increase in both export volume (+7.0%) and average unit value (+5.2%).
Exports to Country of Destination
The two major destinations for Malaysia’s exports in September 2019 were China and Singapore. Exports to China amounted RM10.8 billion, declined RM334.0 million (-3.0%) as compared to the previous year.
The main products which attributed to the decline were:
- E&E products, which contributed 37.0% of total exports dropped RM412.6 million (-9.3%) to RM4.0 billion; and
- Refined petroleum product which contributed 3.9% of total exports reduced RM191.9 million (-31.2%) to RM422.4 million.
However, exports of palm oil and palm oil based products increased RM138.3 million or 24.5%.
Exports to Singapore which were valued at RM10.7 billion declined RM1.4 billion (-11.7%). The main product which attributed to the decrease was E&E products, which contributed 40.2% of total exports fell RM1.6 billion (-26.5%) to RM4.3 billion.
Meanwhile, exports of palm oil and palm oil based products and crude petroleum recorded an increase of RM9.6 million (+6.6%) and RM8.1 million (+3.5%) respectively.
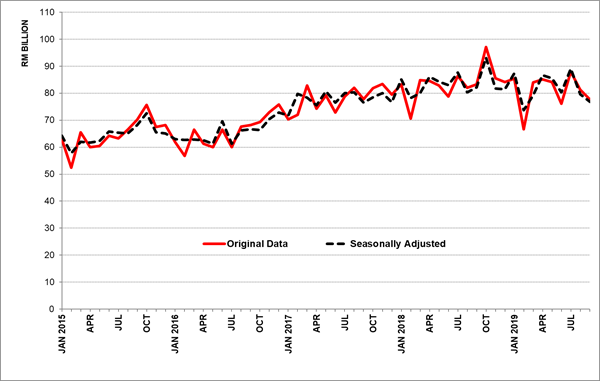
Seasonally Adjusted Figure
On a m-o-m basis seasonally adjusted terms, exports decreased RM2.9 billion (-3.6%) to RM76.8 billion.
Exports, 2015-2019
IMPORTS
On a y-o-y basis, imports grew RM1.6 billion or 2.4% to RM69.4 billion. All main categories of imports by end use recorded increases.
- Intermediate Goods
These goods which constituted 57.6% of total imports rose RM4.0 billion (+11.1%) to RM39.9 billion. The increase was mainly attributed to fuel & lubricants, primary (+RM1.5 billion, +86.4%), parts & accessories of capital goods (except transport equipment) (+RM925.7 million, +7.9%), fuel & lubricants, processed, others (+RM806.0 million, +65.2%) and industrial supplies, primary (+RM755.0 million, +36.3%). However, industrial supplies, processed declined RM551.7 million or 3.5%.
- Consumption Goods
Imports of consumption goods which constituted 8.5% of total imports recorded an increase of RM777.0 million (+15.1%) to RM5.9 billion. The increase was mainly attributed to semi-durables (+RM228.0 million, +27.4%), durables (+RM189.2 million, +32.9%), non-durables (+RM171.8 million, +12.0%) and food & beverages, processed, mainly for household consumption (+RM120.3 million, +8.3%).
- Capital Goods
Imports of capital goods, which accounted for 11.3% of total imports, grew RM531.7 million (+7.3%) to RM7.9 billion due to the increase in both capital goods (except transport equipment) (+RM432.6 million, +6.1%) and transport equipment, industrial (+RM99.1 million, +46.2%).
On a m-o-m basis, imports decreased RM1.1 billion or 1.6% from RM70.5 billion. The reduction in imports was attributed to consumption goods and capital goods.
- Consumption Goods
?Imports of these goods registered a decrease of RM284.2 million (-4.6%) from RM6.2 billion. The drop was due to food & beverages, processed, mainly for household consumption (-RM175.5 million, -10.0%) and semi-durables (-RM93.8 million, -8.1%).
- ?Capital Goods
Imports of capital goods fell RM210.1 million (-2.6%) from RM8.1 billion due to the decline in transport equipment, industrial (-RM241.7 million, -43.5%). However, capital good (except transport equipment) recorded an increase of RM31.6 million or 0.4%.
- Intermediate Goods
These goods increased RM882.2 million (+2.3%) from RM39.0 billion. The main components which contributed to the increase was fuel & lubricants, processed, others (+RM2.0 billion, +5,354.6%) and fuel & lubricants, primary (+RM684.1 billion, +27.7%). However, the declines were recorded in parts & accessories of capital goods (except transport equipment) (-RM730.2 million, -5.5%) and industrial supplies, processed (-RM728.1 million,-4.5%).
Imports by Country of Origin
The two main sources of Malaysia’s import in September 2019 were China and Singapore. Imports from China which registered RM14.4 billion surged
RM1.3 billion (+9.7%) when compared to September 2018.
The main products which attributed to the increase were:
- Refined petroleum products (5.2% of total imports), rose RM449.0 million or 152.4% to RM743.6 million;
- E&E products, which contributed 37.9% of total imports, increased RM239.8 million or 4.6% to RM5.5 billion;
- Timber and timber based products (1.2% of total imports) increased RM58.3 million or 50.4% from RM115.6 million; and
- Palm oil and palm oil based products, which contributed 0.8% of total imports increased RM28.3 million or 35.2%.
Imports from Singapore decreased RM1.5 billion (-16.0%) to RM7.7 billion from a year ago. The main product which attributed to the drop was refined petroleum products (-RM1.6 billion, -41.0%).
However, E&E products, which contributed 35.5% of total imports, increased RM43.4 million or 1.6%.
Seasonally Adjusted Figure
On a m-o-m basis seasonally adjusted terms, imports grew marginally RM16.4 million (+0.02%) to RM68.9 billion.
Imports, 2015-2019

MARKET SHARE
The following charts show Malaysia's major trading partners for January–September 2019.
Total Trade by Major Countries, Jan – Sept 2019, percentage share

Exports and Imports by Major Countries, Jan – Sept 2019, percentage share

The following charts show Malaysia’s trade with ASEAN countries for the period January - September 2019.
Exports, Jan – Sept 2019, percentage share

Imports, Jan – Sept 2019, percentage share

#Notes:
1. The September 2019 data is provisional and subject to revision in later issues.
2. This report can be accessed through the web portal of the Department of Statistics, Malaysia (https://www.dosm.gov.my) under section: Latest Release.
Released By:
DATO' SRI DR. MOHD UZIR MAHIDIN
CHIEF STATISTICIAN MALAYSIA
DEPARTMENT OF STATISTICS, MALAYSIA
![]() DrUzir_Mahidin
DrUzir_Mahidin ![]()
![]() Dr_Uzir
Dr_Uzir
4 NOVEMBER 2019
Contact person:
Rohaida binti Mohamad
Public Relation Officer
Strategic Communication and International Division
Department of Statistics, Malaysia
Tel : +603-8885 7942
Fax : +603-8888 9248
Email : rohaida.mohamad[at]dosm.gov.my
Subscribe
Newsletter
Subscribe to our newsletter and stay updated
For interviews, press statement and clarification to the media, contact:
Baharudin Mohamad
Public Relation Officer
Email: baharudin[at]dosm.gov.my
Phone: 03 8090 4681
Not found what you looking for? Request data from us, through
Go to eStatistik
Email: data[at]dosm.gov.my
Phone: 03 8885 7128 (data request)


