
Malaysia External Trade Statistics
- Home
- Statistics
- Economy
- External Sector
- Malaysia External Trade Statistics
Malaysia External Trade Statistics July 2019
Malaysia External Trade Statistics Jun 2019 4 July 2019
Malaysia External Trade Statistics May 2019 3 June 2019
Malaysia External Trade Statistics April 2019 3 May 2019
Malaysia External Trade Statistics March 2019 4 April 2019
Malaysia External Trade Statistics February 2019 4 March 2019
Malaysia External Trade Statistics January 2019 Show all release archives
Overview
KEY FACTS
MONTHLY
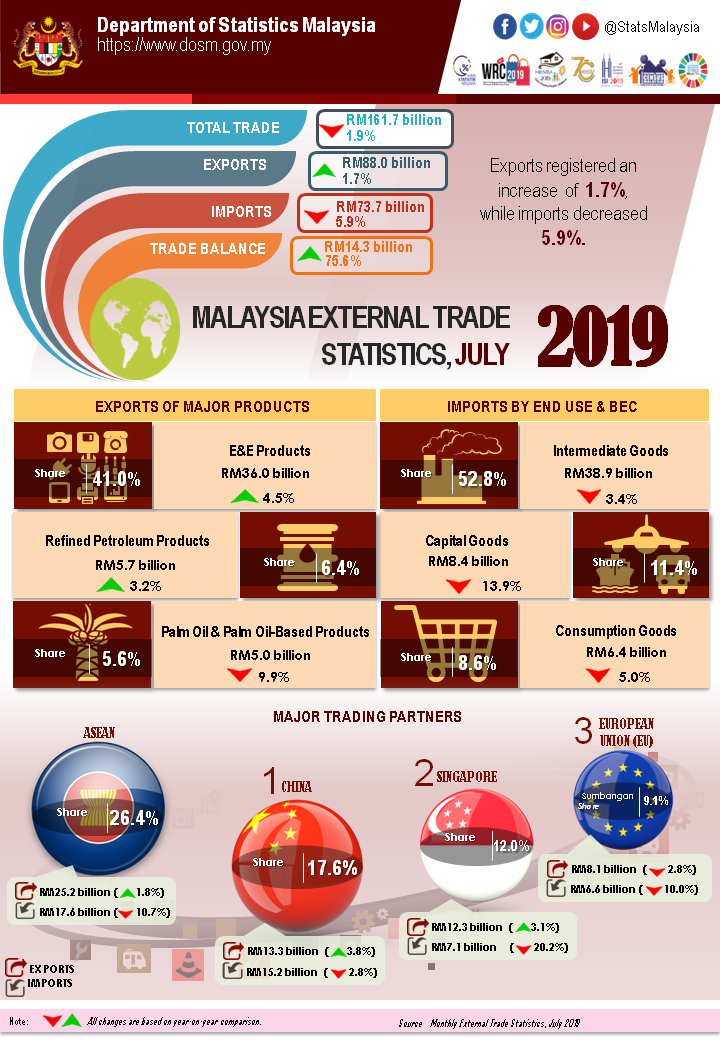
- Malaysia’s exports in July 2019 registered an increase of 1.7% to RM88.0 billion year-on-year (y-o-y). Re-exports was valued at RM17.9 billion registering a decrease of 3.9% y-o-y and accounted for 20.3 % of total exports. However, domestic exports increased 3.3% or RM2.2 billion to RM70.1 billion.
- Imports registered a decrease of 5.9% y-o-y to RM73.7 billion.
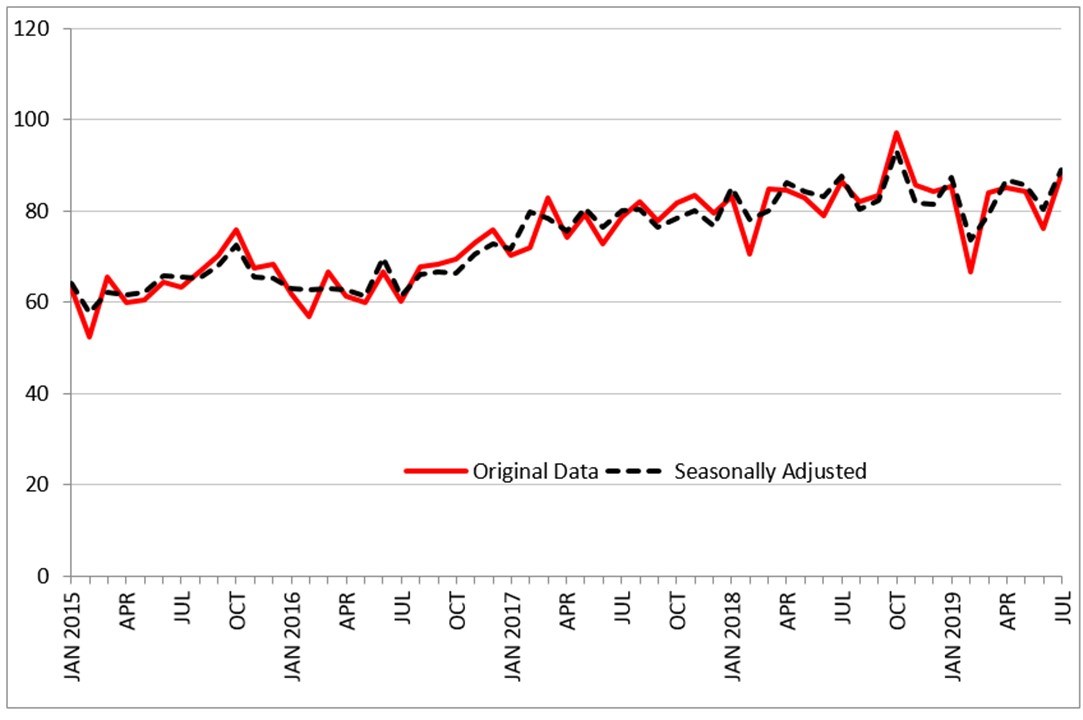
- On a month-on-month (m-o-m) basis, exports grew 15.5% or RM11.8 billion from RM76.1 billion. In seasonally adjusted terms, exports also increased 10.9%.
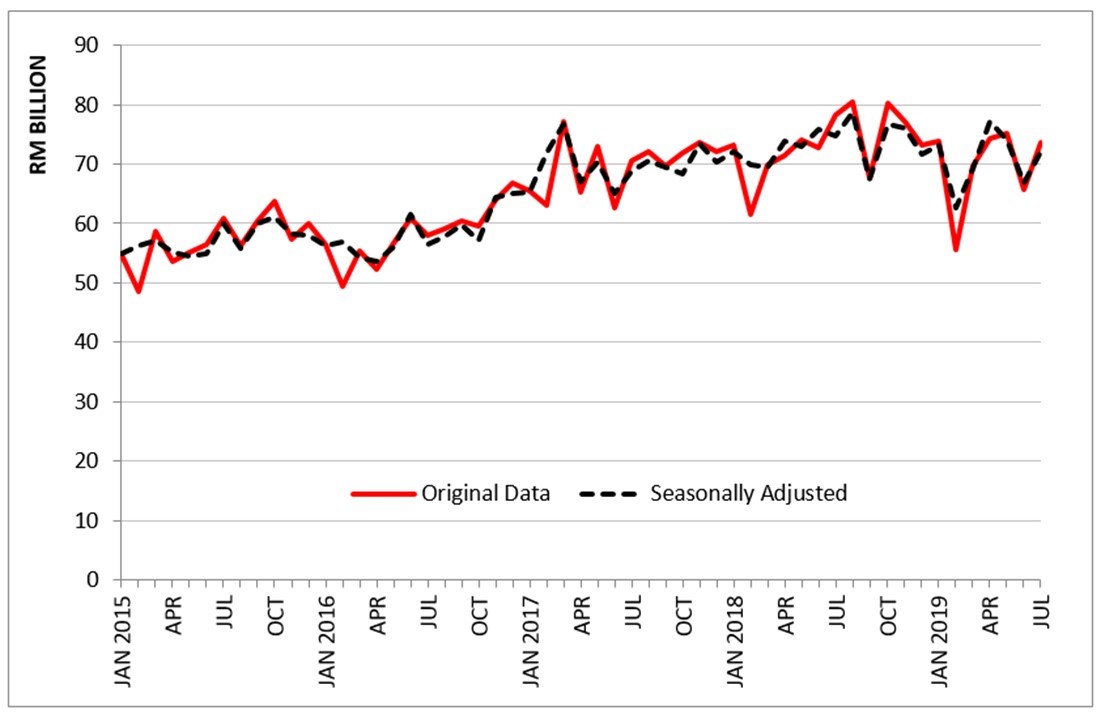
- On a m-o-m basis, imports increased 12.3% or RM8.1 billion from RM65.6 billion. In seasonally adjusted terms, imports increased 7.9%.
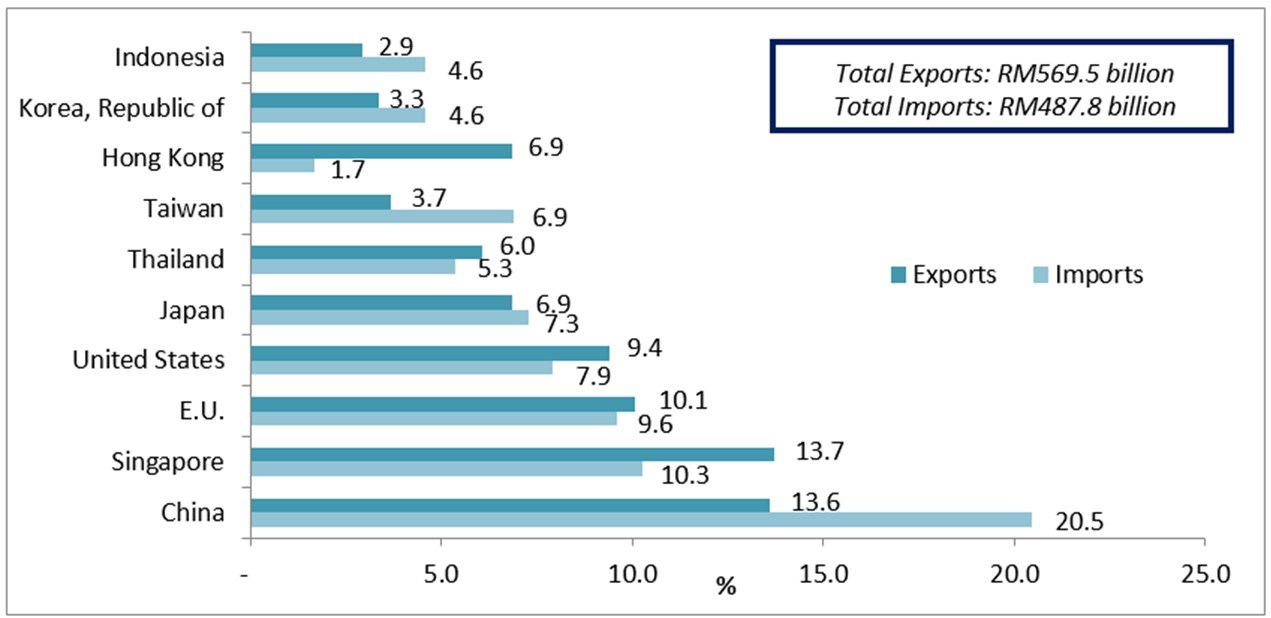
- On a y-o-y basis, exports rose due to the increase in exports to Taiwan (+RM1.2 billion), the United States (+RM610.2 million), China (+RM488.8 million) and Singapore (+RM372.9 million). However, exports decreased to India (-RM534.0 million), Australia (-RM417.9 million) and Japan (-RM352.0 million).
- On a y-o-y basis, lower imports were mainly from Singapore (-RM1.8 billion), Taiwan (-RM1.2 billion), India (-RM822.9 million), the European Union (-RM736.3 million) and Thailand (-RM554.0 million). Meanwhile, higher imports were from Republic of Korea (+RM731.0 million), Iraq (+RM462.8 million) and Brunei (+RM426.0 million).
TRADE
Total trade which was valued at RM161.7 billion decreased RM3.2 billion or 1.9% as compared to July 2018. However, it increased RM19.9 billion or 14.0% when compared to June 2019. The trade surplus was RM14.3 billion, soared RM6.1 billion (+75.6 %) from a year ago. It also registered an increase of 35.8 % or RM3.8 billion as compared to the previous month.
EXPORTS
On a y-o-y basis, exports increased 1.7% to RM88.0 billion. The main products which attributed to the increase were:
- Electrical and electronic (E&E) products (41.0% of total exports), grew RM1.5 billion (+4.5%) to RM36.0 billion;
- Liquefied natural gas (LNG), which accounted for 3.8% of total exports grew RM798.7 million or 31.3% to RM3.3 billion due to the increase in export volume (+44.6%) as average unit value decreased 9.2%;
- Refined petroleum products, which contributed 6.4% to total exports, increased RM174.4 million or 3.2% to RM5.7 billion due to the increase in both average unit value (+1.8%) and export volume (+1.3%);
- Natural rubber, which contributed 0.5% to total exports, increased RM85.4 million or 25.5% to RM420.2 million due to the increase in both export volume (+19.1%) and average unit value (+5.4%); and
- Timber and timber-based products, which contributed 2.2% to total exports, increased RM23.7 million or 1.2% to RM 1.9 billion.
However, the following products recorded decreases:
- Crude petroleum, which contributed 2.4% to total exports dropped RM1.7 billion or 45.7% to RM2.1 billion due to the decrease in both export volume (-45.0%) and average unit value (-1.2%); and
- Palm oil and palm oil-based products (5.6% of total exports), fell RM544.5 million (-9.9%) to RM5.0 billion. Exports of palm oil, the major commodity in this group of products decreased RM428.1 million or 14.2% due to the drop in average unit value (-15.8%) as export volume increased 2.0%.
On a m-o-m basis, exports increased RM 11.8 billion (+15.5%) from RM 76.1 billion. The main products which contributed to the increase were:
- Electrical and electronic (E&E) products rose RM8.0 billion (+28.4%) from RM28.1 billion;
- Timber and timber-based products increased RM515.8 million (+36.1%) from RM1.4 billion;
- LNG, increased RM461.7 million (+16.0%) from RM2.9 billion due to the increase in both export volume (+12.6%) and average unit value (+3.0%);
- Refined petroleum products rose RM88.1 million or 1.6% from RM5.6 billion due to the increase in export volume (+2.0%) as average unit value decreased 0.4%; and
- Natural rubber grew RM76.7 million or 22.3% from RM343.5 million due to the increase in export volume (+23.3%) as average unit value decreased 0.8%.
However, the following products recorded decreases:
- Crude petroleum, dropped RM1.1 billion or 33.6% to RM2.1 billion due to the decrease in both export volume (-32.7%) and average unit value (-1.3%); and
- Palm oil and palm oil-based products, fell RM78.9 million (-1.6%) to RM5.0 billion. Exports of palm oil, decreased RM237.3 million or 8.4% due to the drop in both export volume (-7.6%) and average unit value (-0.9%).
Exports to Country of Destination
The two major destinations for Malaysia’s exports in July 2019 were China and Singapore. Exports to China amounted RM13.3 billion, increased RM488.8 million (+3.8%) as compared to the previous year.
The main products which attributed to the increase were:
- LNG which contributed 6.4% of total exports increased RM257.5 million (+43.5%) to RM848.9 million; and
- Refined petroleum product which contributed 5.6% of total exports grew RM206.0 million (+37.7%) to RM752.3 million.
Exports to Singapore which were valued at RM12.3 billion grew RM372.9 million (+3.1%). The main product which attributed to the increase was E&E products, which contributed 50.1% of total exports rose RM572.6 million (+10.2%) to RM6.2 billion.
However, the following products recorded decreases:
- Crude petroleum (0.5% of total exports), dropped RM128.4 million or 69.1% to RM57.3 million; and
- Refined petroleum products, which contributed 10.4% of total exports shrank RM191.4 million or 13.0% to RM1.3 billion.
Seasonally Adjusted Figure
On a m-o-m basis seasonally adjusted terms, exports grew RM8.7 billion (+10.9%) to RM89.0 billion.
Exports, 2015-2019
IMPORTS
On a y-o-y basis, imports declined RM4.7 billion or 5.9% to RM 73.7 billion. The decline in imports was mainly attributed to capital goods, intermediate goods and consumption goods.
- Capital Goods
Imports of capital goods, which accounted for 11.4% of total imports, dropped RM1.4 billion (-13.9%) to RM8.4 billion due to the decline in both transport equipment, industrial (-RM838.3 million, -58.8%) and capital goods (except transport equipment) (-RM525.5 million, -6.3%).
- Intermediate Goods
These goods which constituted 52.8% of total imports fell RM1.4 billion (-3.4%) to RM38.9 billion. The decrease was mainly attributed to parts & accessories of capital goods (except transport equipment) (-RM2.2 billion, -19.6%) and industrial supplies, processed (-RM1.6 billion, -8.9%). However, the increase were recorded for industrial supplies, primary (+RM937.7 million, +47.9%), fuel & lubricants, primary (+RM644.4 million, +19.0%) and fuel & lubricants, processed, others (+RM559.9 million, +35.1%).
- Consumption Goods
Imports of consumption goods which constituted 8.6% of total imports recorded a decrease of RM333.7 million (-5.0%) to RM6.4 billion. The decrease was mainly attributed to semi-durables (-RM285.8 million, -18.9%) and durables (-RM176.7 million, -17.9%).
On a m-o-m basis, imports grew RM8.1 billion or 12.3% from RM65.6 billion. All main categories of imports by end use recorded increases.
- Capital Goods
Imports of capital goods increased RM1.3 billion (+18.1%) from RM7.1 billion due to the increase in capital good (except transport equipment) (+RM1.4 billion, +22.3%) as transport equipment, industrial decreased RM139.0 million or 19.2%.
- Consumption Goods
Imports of these goods registered an increase of RM 779.1 million (+14.0%)from RM5.6 billion. The increase was due to food & beverages, processed, mainly for household consumption (+RM231.4 million, +15.1%), semi-durables (+RM223.1 million, +22.2%) and food & beverages, primary, mainly for household consumption (+RM131.2 million, +18.2%).
- Intermediate Goods
These goods rose RM698.7 million (+1.8%) from RM38.2 billion. The main components contributed to the increase were industrial supplies, processed (+RM2.1 billion, +14.5%), fuel & lubricants, primary (+RM1.2 billion, +41.8%), industrial supplies, primary (+RM 549.9 million, +23.5%), parts & accessories of transport equipment (+RM293.9 million, +11.4%) and fuel & lubricants, processed, others (+RM174.5 million, +8.8%). However, parts & accessories of capital goods (except transport equipment) dropped RM3.8 billion or 30.1%.
Imports by Country of Origin
The two main sources of Malaysia’s import in July 2019 were China and Singapore. Imports from China which registered RM15.2 billion shrank RM439.8 million (-2.8%) when compared to July 2018.
The main product which attributed to the decrease was E&E products, which contributed 35.8% of total imports, dropped RM363.5 million or 6.3% to RM5.4 billion.
Imports from Singapore decreased RM1.8 billion (-20.2%) to RM7.1 billion from a year ago. The main products which attributed to the drop were:
- E&E products, which contributed 30.3% of total imports fell RM899.9 million (-29.5%) to RM2.2 billion; and
- Refined petroleum products (30.6% of total imports), decreased RM744.8 million or 25.5% to RM2.2 billion.
Seasonally Adjusted Figure
On a m-o-m basis seasonally adjusted terms, imports increased RM5.3 billion (+7.9%) to RM72.0 billion.
Imports, 2015-2019
MARKET SHARE
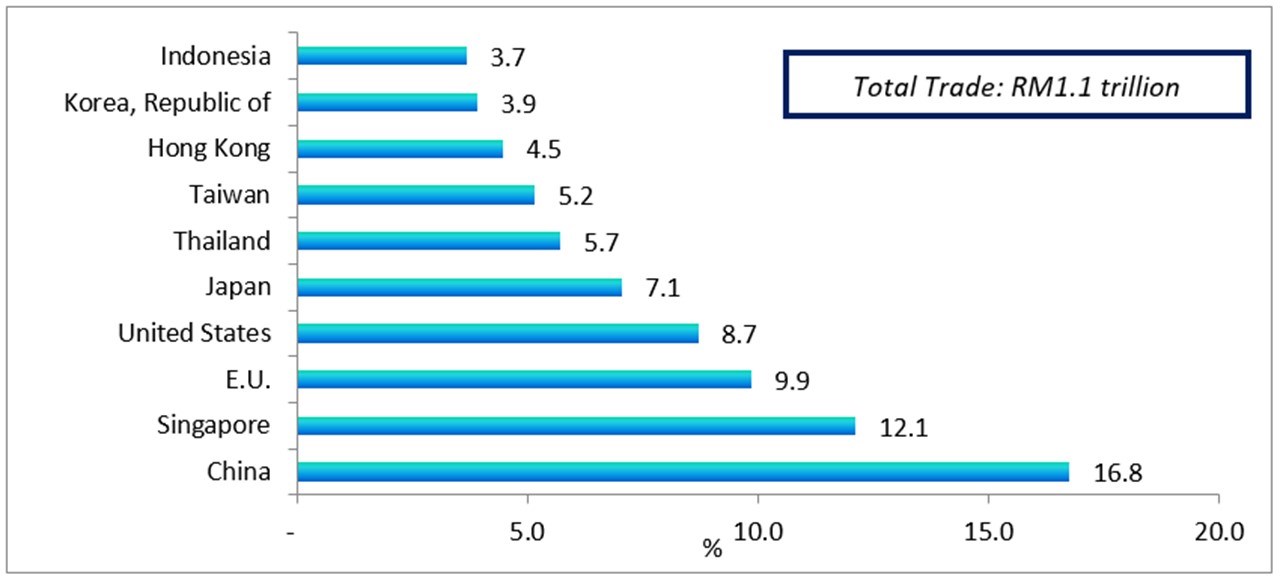
The following charts show Malaysia's major trading partners for January – July 2019.
Total Trade by Major Countries, Jan – July 2019, percentage share
Exports and Imports by Major Countries, Jan – July 2019, percentage share
The following charts show Malaysia’s trade with ASEAN countries for the period January - July 2019.
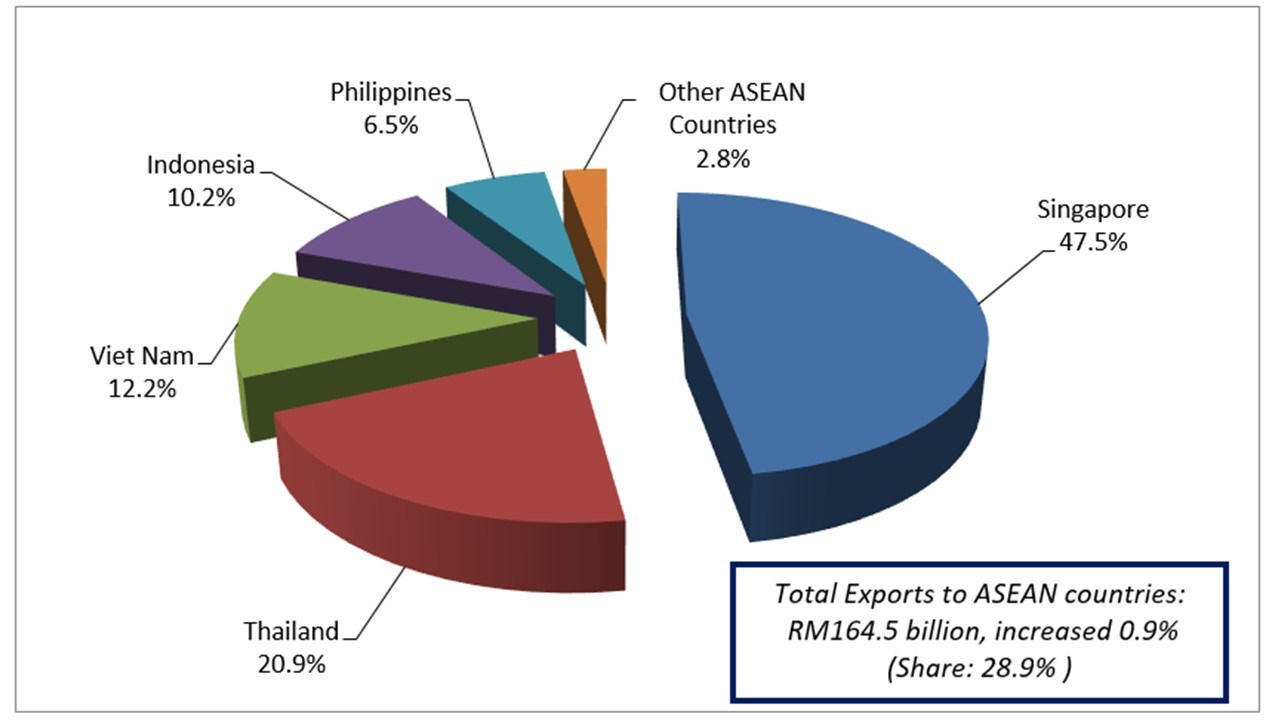
Exports, Jan – July 2019, percentage share
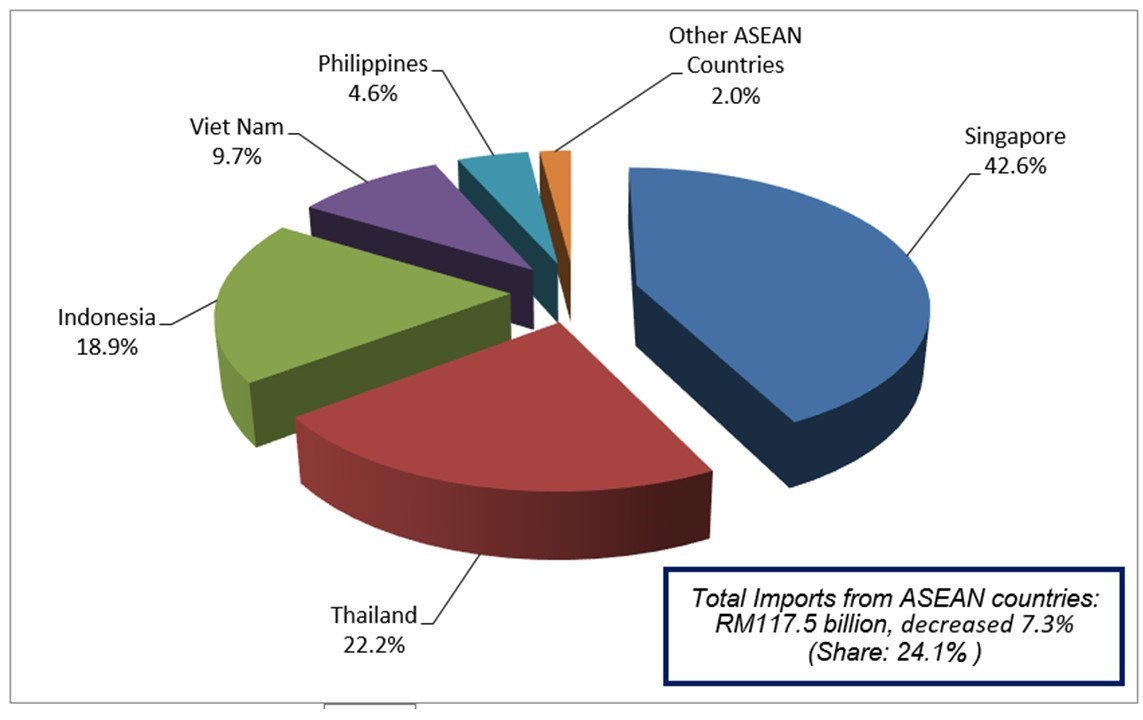
Imports, Jan – July 2019, percentage share
#Notes:
1. The July 2019 data is provisional and subject to revision in later issues.
2. This report can be accessed through the web portal of the Department of Statistics, Malaysia (https://www.dosm.gov.my) under section: Latest Release.
Released By:
DATO' SRI DR. MOHD UZIR MAHIDIN
CHIEF STATISTICIAN MALAYSIA
DEPARTMENT OF STATISTICS, MALAYSIA
![]() DrUzir_Mahidin
DrUzir_Mahidin ![]()
![]() Dr_Uzir
Dr_Uzir
4 SEPTEMBER 2019
Contact person:
Rohaida binti Mohamad
Public Relation Officer
Strategic Communication and International Division
Department of Statistics, Malaysia
Tel : +603-8885 7942
Fax : +603-8888 9248
Email : rohaida.mohamad[at]dosm.gov.my
Subscribe
Newsletter
Subscribe to our newsletter and stay updated
For interviews, press statement and clarification to the media, contact:
Baharudin Mohamad
Public Relation Officer
Email: baharudin[at]dosm.gov.my
Phone: 03 8090 4681
Not found what you looking for? Request data from us, through
Go to eStatistik
Email: data[at]dosm.gov.my
Phone: 03 8885 7128 (data request)


