
Malaysia External Trade Statistics
- Home
- Statistics
- Economy
- External Sector
- Malaysia External Trade Statistics
Malaysia External Trade Statistics April 2019
Malaysia External Trade Statistics March 2019 4 April 2019
Malaysia External Trade Statistics February 2019 4 March 2019
Malaysia External Trade Statistics January 2019 30 January 2019
Malaysia External Trade Statistics December 2018 4 January 2019
Malaysia External Trade Statistics November 2018 5 December 2018
Malaysia External Trade Statistics October 2018 Show all release archives
Overview

KEY FACTS
MONTHLY
- In April 2019, exports increased 1.1% to RM85.2 billion year-on-year (y-o-y). Domestic exports recorded an increase of 11.9% or RM7.6 billion to RM71.7 billion. Re-exports was valued at RM13.5 billion registering a decline of 33.1% y-o-y and accounted for 15.8% of total exports.
- Imports also registered an increase of 4.4% y-o-y to RM74.3 billion.
- On a month-on-month (m-o-m) basis, exports recorded a growth of 1.4% from RM84.1 billion. In seasonally adjusted terms, exports also rose 9.5%.
- On a m-o-m basis, imports also expanded 6.7% or RM4.7 billion from RM69.7 billion. In seasonally adjusted terms, imports increased 11.3%.
- On a y-o-y basis, exports grew due to the increase in exports to Singapore (+RM1.2 billion), Viet Nam (+RM491.3 million), Japan (+RM388.5 million), Taiwan (+RM310.0 million) and the United States (+RM231.2 million). However, exports decreased to China (-RM857.1 million), the European Union (-RM770.7 million) and Switzerland (-RM375.3 million).
- On a y-o-y basis, higher imports were mainly from China (+RM1.2 billion), Saudi Arabia (+RM694.5 million), Australia (+RM468.6 million), Iraq (+RM330.3 million) and Indonesia (+RM220.4 million). Meanwhile, lower imports were from Singapore (-RM1.3 billion), Switzerland (-RM422.2 million) and Kuwait (-RM154.4 million).
TRADE
Total trade which was valued at RM159.5 billion increased RM4.1 billion or 2.6% in April 2019. It is also posted a growth of RM5.8 billion or 3.8% when compared to the previous month. The trade surplus shrank RM2.2 billion (-16.6%) from a year ago and RM3.5 billion (-24.5%) from the previous month respectively to RM10.9 billion.
EXPORTS
On a y-o-y basis, exports increased 1.1% to RM85.2 billion. The main products which attributed to the expansion were:
- Electrical and electronic (E&E) products (38.9% of total exports), grew RM1.2 billion (+3.9%) to RM33.1 billion;
- Refined petroleum products, which accounted for 7.5% of total exports, rose RM1.2 billion or 22.3% to RM6.4 billion due to the increase in both average unit value (+13.3%) and export volume (+7.9%);
- Liquefied natural gas (LNG), which accounted for 4.2% of total exports grew RM749.7 million or 26.3% to RM3.6 billion due to the increase in both export volume (+21.2%) and average unit value (+4.3%); and
- Natural rubber (0.4% of total exports) increased RM19.0 million or 6.0% to RM334.9 million due to the rise in both export volume (+5.1%) and average unit value (+0.8%).
However, decreases were recorded for the following products:
- Crude petroleum, which contributed 2.2% to total exports dropped RM1.0 billion or 34.6% to RM1.9 billion due to the decrease in export volume (-37.4%) as average unit value rose 4.4%;
- Palm oil and palm oil-based products (6.1% of total exports), shrank RM899.0 million (-14.8%) to RM5.2 billion. Exports of palm oil, the major commodity in this group of products declined RM642.8 million or 17.3% due to the decrease in both average unit value (-13.7%) and export volume (-4.1%); and
- Timber and timber-based products, which contributed 2.1% to total exports shrank RM58.1 million or 3.1% to RM1.8 billion.
On a m-o-m basis, exports rose RM1.1 billion (+1.4%) from RM84.1 billion. The main products which contributed to the growth were:
- E&E products expanded RM1.9 billion (+6.0%) from RM31.2 billion;
- Refined petroleum products rose RM1.4 billion (+28.1%) from RM5.0 billion due to the increase in both export volume (+18.6%) and average unit value (+8.0%); and
- Natural rubber grew RM29.0 million or 9.5% from RM305.9 million due to the rise in both export volume (+5.0%) and average unit value (+4.3%).
However, the following products recorded decreases:
- Crude petroleum dropped RM513.1 million or 21.3% from RM2.4 billion due to the fall in export volume (-24.5%) as average unit value increased 4.2%;
- LNG decreased RM275.2 million or 7.1% from RM3.9 billion due to the decrease in average unit value (-9.5%) as export volume increased 2.6%;
- Palm oil and palm oil-based products shrank RM254.0 million or 4.7% from RM5.4 billion. Exports of palm oil decreased RM10.6 million or 0.3% due to the fall in average unit value (-2.2%) as export volume increased 1.9% ; and
- Timber and timber-based products decreased RM84.6 million (-4.5%) from RM1.9 billion.
Exports to Country of Destination
The two major destinations for Malaysia’s exports in April 2019 were Singapore and China. Exports to Singapore amounted to RM12.2 billion, an increase of RM1.2 billion (+11.3%) as compared to the previous year.
The main products which attributed to the rise were:
- Refined petroleum products (13.9% of total exports), increased RM416.7 million or 32.6% to RM1.7 billion;
- E&E products, which contributed 43.8% of total exports grew RM369.5 million (+7.4%) to RM5.3 billion; and
- Crude petroleum which contributed 4.6% of total exports increased RM57.9 million or 11.5% to RM563.1 million.
Exports to China which were valued at RM11.5 billion declined RM857.1 million (-6.9%). The main product which attributed to the decrease was E&E products, which contributed 37.2% of total exports shrank RM892.7 million (-17.2%) to RM4.3 billion.
Seasonally Adjusted Figure
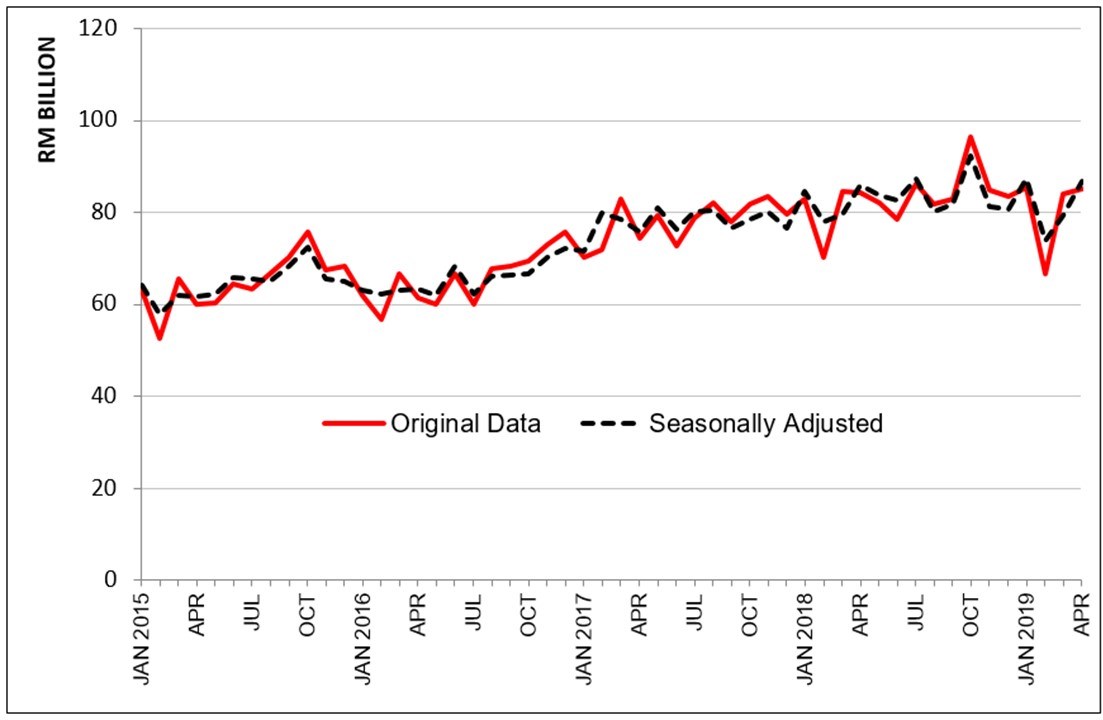
On a m-o-m basis seasonally adjusted terms, exports rose RM7.5 billion (+9.5%) to RM86.8 billion.
Exports, 2015-2019
IMPORTS
On a y-o-y basis, imports grew RM3.1 billion or 4.4% to RM74.3 billion. The increase in imports was mainly attributed to intermediate goods, consumption goods and capital goods.
- Intermediate Goods
These goods which constituted 54.8% of total imports increased RM6.9 billion (+20.3%) to RM40.7 billion. The growth was mainly attributed to industrial supplies, processed (+RM3.5 billion, +25.4%), fuel & lubricants, primary (+RM1.5 billion, +60.5%) and parts & accessories of capital goods (except transport equipment) (+RM1.1 billion, +11.4%).
- Consumption Goods
Imports of consumption goods which constituted for 8.9% of total imports grew RM1.1 billion (+18.9%) to RM6.6 billion. The growth was mainly attributed to non-durables (+RM377.7 million, +30.2%), food & beverages, processed, mainly for household consumption (+RM252.5 million, +16.0%) and durables (+RM210.1 million, +28.2%).
- Capital Goods
Imports of capital goods, which accounted for 11.9% of total imports, rose RM475.9 million (+5.7%) to RM8.9 billion due to the increase in capital goods (except transport equipment) (+RM904.9 million, +12.5%). However, transport equipment industrial decreased RM429.0 million or 36.6%.
On a m-o-m basis, imports surged RM4.7 billion or 6.7% from RM69.7 billion. All main categories of imports by end use recorded increases.
- Intermediate Goods
These goods rose RM2.7 billion (+7.1%) from RM38.0 billion. The main components contributed to the increase were industrial supplies, processed (+RM2.6 billion, +17.8%) and fuel & lubricants primary (+RM614.5 million, +18.4%). However, parts & accessories of capital goods (except transport equipment) decreased RM1.0 billion or 8.6%.
- Consumption Goods
Imports of these goods registered an increase of RM724.6 million (+12.3%)from RM5.9 billion. The increase was due to semi-durables (+RM274.8 million, +29.6%), durables (+RM141.1 million, +17.3%), non-durables(+RM120.9 million, +8.0%), and food & beverages, processed, mainly for household consumption (+RM112.6 million, +6.5%).
- Capital Goods
Imports of capital goods increased RM567.9 million (+6.8%) from RM8.3 billion due to the increase in capital goods (except transport equipment (+RM769.5 million, +10.5%). However, transport equipment, industrial decreased RM201.6 million or 21.3%.
Imports by Country of Origin
The two main sources of Malaysia’s import in April 2019 were China and the European Union. Imports from China which registered RM15.1 billion roseRM1.2 billion (+8.8%) when compared to April 2018.
The main products which attributed to the growth were:
- Motor cars and other motor vehicles (2.5% of total imports) increased RM367.4 million to RM370.0 million;
- Aluminium (including alloys), which accounted for 2.5% of total imports, rose RM169.3 million or 79.9% to RM381.2 million;
- E&E products, which contributed 33.8% of total imports grew RM196.0 million or 4.0% to RM5.1 billion; and
- Refined petroleum products (7.3% of total imports), increased RM55.3 million or 5.3% to RM1.1 billion.
Imports from the European Union increased RM70.6 million (+1.0%) to RM7.3 billion from a year ago. The main product which attributed to the increase was refined petroleum products (6.7% of total imports), grew RM433.5 million or 832.0% to RM485.6 million. However, import of E&E products declined RM120.6 million or 7.1% to RM1.6 billion.
Seasonally Adjusted Figure
On a m-o-m basis seasonally adjusted terms, imports increased RM7.8 billion (+11.3%) to RM77.1 billion.
Imports, 2015-2019

MARKET SHARE
The following charts show Malaysia's major trading partners for January - April 2019.
Total Trade by Major Countries, Jan – Apr 2019, percentage share

Exports and Imports by Major Countries, Jan – Apr 2019, percentage share

The following charts show Malaysia’s trade with ASEAN countries for January – April 2019.
Exports, Jan – Apr 2019, percentage share

Imports, Jan – Apr 2019, percentage share

#Notes:
1. The April 2019 data is provisional and subject to revision in later issues.
2. This report can be accessed through the web portal of the Department of Statistics, Malaysia (https://www.dosm.gov.my) under section: Latest Release.
Released By:
DATO' SRI DR. MOHD UZIR MAHIDIN
CHIEF STATISTICIAN MALAYSIA
DEPARTMENT OF STATISTICS, MALAYSIA
![]() DrUzir_Mahidin
DrUzir_Mahidin ![]()
![]() Dr_Uzir
Dr_Uzir
3 JUNE 2019
Contact person:
Public Relation Officer
Strategic Communication and International Division
Department of Statistics, Malaysia
Tel : +603-8885 7187 / 7942
Fax : +603-8888 9248
Email : jpbkkp[at]dosm.gov.my
Subscribe
Newsletter
Subscribe to our newsletter and stay updated
For interviews, press statement and clarification to the media, contact:
Baharudin Mohamad
Public Relation Officer
Email: baharudin[at]dosm.gov.my
Phone: 03 8090 4681
Not found what you looking for? Request data from us, through
Go to eStatistik
Email: data[at]dosm.gov.my
Phone: 03 8885 7128 (data request)


