
Malaysia External Trade Statistics
- Home
- Statistics
- Economy
- External Sector
- Malaysia External Trade Statistics
Malaysia External Trade Statistics September 2018
Overview

KEY FACTS
MONTHLY
- In September 2018, exports expanded 6.7% to RM83.0 billion year-on-year (y-o-y). Re-exports was valued at RM16.5 billion registering an increase of 26.2% y-o-y and accounted for 19.9% of total exports. Domestic exports also recorded an increase of 2.7% or RM1.8 billion to RM66.5 billion.
- Imports registered a decrease of 2.7% y-o-y to RM67.8billion. This was the second lowest of import value in 2018.
- On a month-on-month (m-o-m) basis, exports increased 1.5% or RM1.2 billion from RM81.8 billion. In seasonally adjusted terms, exports also rose1.1%.
- On a m-o-m basis, imports decreased 15.5% or RM12.4 billion from RM80.2 billion. In seasonally adjusted terms, imports also declined14.7%.
- On a y-o-y basis, export growth was contributed by expansion in exports to Hong Kong (+RM2.2 billion), Taiwan (+RM1.0 billion), Singapore (+RM974.7 million), Australia (+RM539.5 million) and Republic of Korea (+RM454.7 million).
- On a y-o-y basis, lower imports were mainly from India (-RM725.6 million), Republic of Korea (-RM579.3 million), Viet Nam (-RM434.6 million), United Arab Emirates (-RM348.1 million) and European Union (-RM348.0 million).
QUARTERLY
- In 3rdquarter 2018, exports recorded an increase of 5.2% y-o-y to RM251.0 billion. Re-exports was valued at RM48.7 billion rising 35.4% y-o-y and accounted for 19.4% of total exports. Domestic exports marginally decreased 0.2% to RM202.3 billion compared to the previous year.
- Imports also registered an increase of 6.3% y-o-y to RM225.8 billion.
- On a quarter-on-quarter (q-o-q) basis, exports rose 2.5% from RM245.0 billion.
- On a q-o-q basis, imports was also higher by 3.7% from RM217.8 billion.
- On a y-o-y basis, export growth was contributed by expansion in exports to Hong Kong (+RM7.2 billion), China (+RM4.0 billion), Taiwan (+RM2.2 billion), Republic of Korea (+RM1.6 billion) and Thailand (+RM1.2 billion).
- On a y-o-y basis, higher imports were mainly from China (+RM3.8 billion), Saudi Arabia (+RM3.1 billion), Taiwan (+RM2.6 billion), Indonesia (+RM1.7 billion) and the United States of America (+RM1.6 billion).
TRADE
Total trade which was valued at RM150.8 billion increased RM3.3 billion or 2.3% in September 2018. However, it fell RM11.2 billion or 6.9% when compared to August 2018. The trade surplus recorded the highest value since October 2008 at RM15.3 billion, increased of RM7.1 billion (+85.9%) from a year ago. It was also higher by RM13.7 billion (+846.3%) when compared to the previous month.
EXPORTS
On a y-o-y basis, exports increased 6.7% to RM83.0 billion. The main products which contributed to the increase were:
- Electrical and electronic (E&E) products (39.6% of total exports), increased RM2.0 billion (+6.5%) to RM32.9 billion;
- Refined petroleum products, which accounted for 6.8% of total exports, rose RM961.9 million or 20.5% to RM5.7 billion due to the increase in both average unit value (+12.2%) and export volume (+7.4%);
- Crude petroleum, which contributed 3.2% to total exports increased RM950.5 million or 54.5% to RM2.7billion due to the increase in both average unit value (+38.1%) and export volume (+11.9%); and
- Liquefied natural gas (LNG), which accounted for 3.8% of total exports grew RM54.8 million or 1.8% to RM3.1 billion due to the increase in average unit (+20.7%) as export volume decreased 15.6%.
However, declines were recorded for the following products:
- Palm oil and palm oil-based products (6.7% of total exports), shrank RM720.4 million (-11.5%) to RM5.6 billion. Exports of palm oil, the major commodity in this group of products declined RM563.1 million or 14.3% due to the decrease in average unit value (-15.5%) as export volume increased 1.4%;
- Timber and timber-based products, which contributed 2.1% to total exports, recorded a marginal decrease of RM6.7 million or 0.4% to RM1.8 billion; and
- Natural rubber (0.4% of total exports) decreased RM6.1 million or 1.9% to RM306.5 million due to the 15.5% decline in average unit value as export volume increased 16.0%.
On a m-o-m basis, exports rose RM1.2 billion (+1.5%) from RM81.8 billion. The main products which contributed to the growth were:
- Refined petroleum products expanded RM1.1 billion or 24.9% from RM4.5 billion due to the increase in export volume (+36.2%) as average unit value decreased 8.3%;
- E&E products increased RM838.4 million (+2.6%) from RM32.0 billion; and
- Palm oil and palm oil-based products rose RM510.1 million or 10.1% from RM5.1 billion. Exports of palm oil increased RM585.6 million or 21.1% due to the growth in export volume (+24.9%) as average unit value declined 3.0%.
However, decreases were recorded for the following products:
- Crude petroleum shrank RM598.2 million or 18.2% from RM3.3 billion due to the decrease in export volume (-19.4%) as average unit value rose1.5%;
- Timber and timber-based products declined RM222.6 million (-11.2%) from RM2.0 billion;
- Natural rubber recorded a decrease of RM30.5 million or 9.1% from RM337.0 million due to the lower export volume (-9.2%) although average unit value increased marginally 0.2%; and
- LNG decreased RM20.6 million (-0.7%) from RM3.2 billion due to the decline in export volume (-6.2%) as average unit value increased 5.9%.
Seasonally Adjusted Figure
On a m-o-m basis seasonally adjusted terms, exports increased RM847.2 million (+1.1%) to RM80.8 billion.
Exports, 2014-2018

IMPORTS
On a y-o-y basis, imports declined RM1.9 billion or 2.7% to RM67.8 billion. All main categories of imports by end use recorded decreases.
- Intermediate Goods
These goods which constituted 52.8% of total imports declined RM3.7 billion (-9.3%) to RM35.8 billion. The decrease was mainly attributed to parts & accessories of capital goods (except transport equipment)(-RM3.7 billion, -24.1%), fuel & lubricants, processed, others (-RM869.4 million, -44.8%), and fuel & lubricants, primary (-RM220.3 million, -11.5%). However, industrial supplies processed increased RM1.1 billion or 7.2%.
- Capital Goods
Imports of capital goods, which accounted for 10.7% of total imports, shrank RM2.5 billion (-25.2%) to RM7.3 billion due to the decline in both transport equipment, industrial (-RM1.3 billion, -86.0%) and capital goods (except transport equipment) (-RM1.1 billion, -13.9%).
- Consumption Goods
Imports of consumption goods which constituted for 7.6% of total imports recorded a decrease of RM573.8 million (-10.0%) to RM5.2 billion. The decrease was mainly attributed to semi-durables (-RM380.2 million, -31.4%), food & beverages, processed, mainly for household consumption (-RM96.9 million, -6.2%) and durables (-RM83.4 million, -12.7%).
On a m-o-m basis, imports declined RM12.4 billion or 15.5% from RM80.2 billion. The decrease in imports by end use was attributed to intermediate goods, capital goods and consumption goods.
- Intermediate Goods
These goods shrank RM9.2 billion (-20.4%) from RM45.0billion. The main components attributed to the decrease were parts & accessories of capital goods (except transport equipment) (-RM3.4 billion, -22.6%), fuel & lubricants, primary (-RM2.3 billion, -57.5%),industrial supplies, processed (-RM1.8 billion, -10.1%) and part & accessories of transport equipment (-RM1.1 billion, -33.8%).
- Capital Goods
Imports of capital goods declined RM4.4 billion (-37.4%) from RM11.6 billion due to the decrease in both capital goods (except transport equipment) (-RM2.7 billion, -27.4%) and transport equipment, industrial (-RM1.7 billion, -88.7%).
- Consumption Goods
Imports of these goods registered a decrease of RM2.0 billion (-27.7%) from RM7.1 billion. The decline was due to semi-durables (-RM829.9 million, -50.0%), durables (-RM660.7 million, -53.5%) and food & beverages, processed, mainly for household consumption (-RM259.1 million, -15.1%).
Seasonally Adjusted Figure
On a m-o-m basis seasonally adjusted terms, imports decreased RM11.6 billion (-14.7%) to RM67.3 billion.
Imports, 2014-2018

MARKET SHARE
The following charts show Malaysia's major trading partners for January - September 2018.
Total Trade by Major Countries, Jan - Sep 2018, percentage share

Exports and Imports by Major Countries, Jan - Sep 2018, percentage share

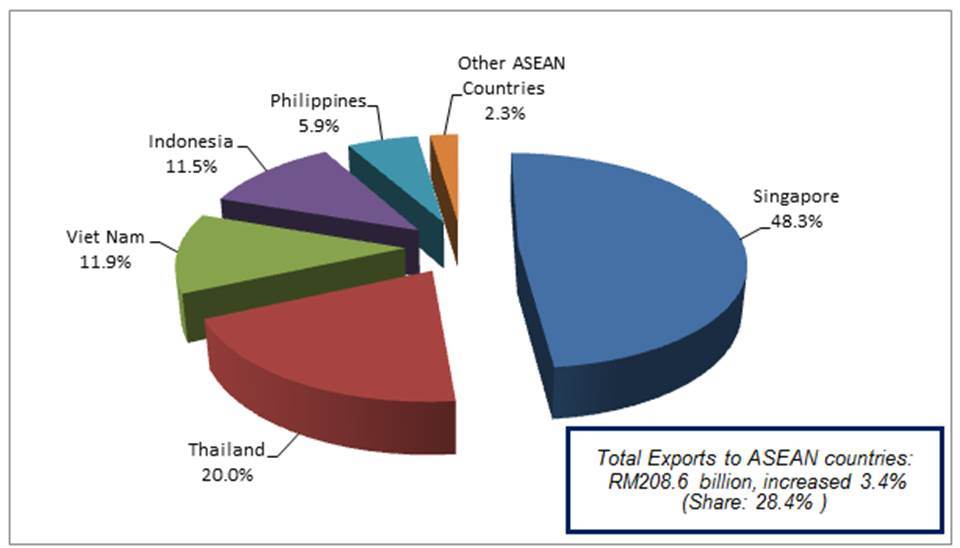
The following charts show Malaysia’s trade with ASEAN countries for January - September 2018.
Exports, Jan - Sep 2018, percentage share
Imports, Jan - Sep 2018, percentage share

Notes:
# The September 2018 data is provisional and subject to revision in later issues.
Released By:
DATO' SRI DR. MOHD UZIR MAHIDIN
CHIEF STATISTICIAN MALAYSIA
DEPARTMENT OF STATISTICS, MALAYSIA
![]() DrUzir_Mahidin
DrUzir_Mahidin ![]()
![]() Dr_Uzir
Dr_Uzir
05 NOVEMBER 2018
Contact person:
Ho Mei Kei
Public Relation Officer
Strategic Communication and International Division
Department of Statistics, Malaysia
Tel : +603-8885 7942
Fax : +603-8888 9248
Email : mkho[at]dosm.gov.my
Subscribe
Newsletter
Subscribe to our newsletter and stay updated
For interviews, press statement and clarification to the media, contact:
Baharudin Mohamad
Public Relation Officer
Email: baharudin[at]dosm.gov.my
Phone: 03 8090 4681
Not found what you looking for? Request data from us, through
Go to eStatistik
Email: data[at]dosm.gov.my
Phone: 03 8885 7128 (data request)


