
Malaysia External Trade Statistics
- Home
- Statistics
- Economy
- External Sector
- Malaysia External Trade Statistics
Malaysia External Trade Statistics August 2018
Overview
KEY FACTS
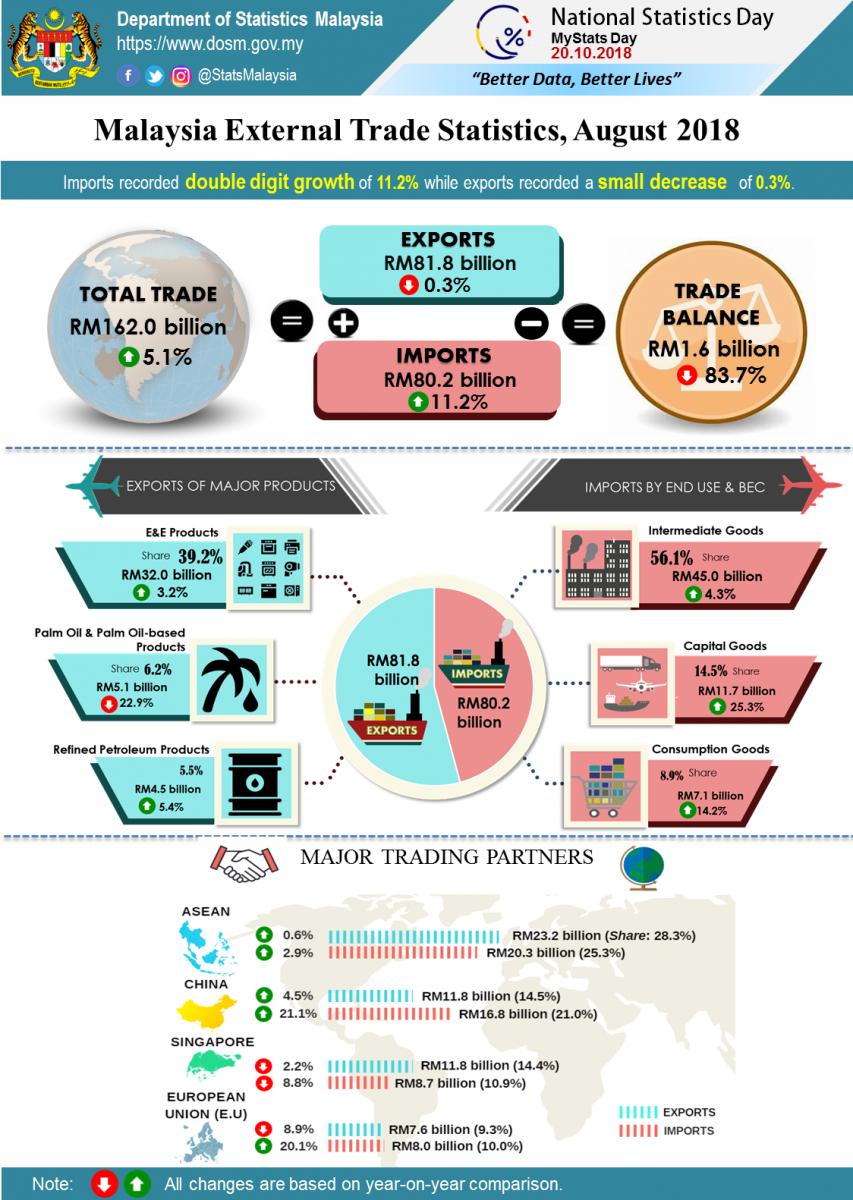
- On a year-on-year (y-o-y) basis, exports fell marginally RM215.2 million or 0.3% to RM81.8 billion. This is the second time exports recorded a decrease in 2018 after February due to high base effect. Re-exports in August 2018 was valued at RM13.5 billion and accounted for 16.5% of total exports. Domestic exports reduced 4.1% (-RM2.9 billion) to RM68.3 billion.
- On a y-o-y basis,imports recorded a double digit growth of 11.2% or RM8.1 billion to RM80.2 billion.
- Trade surplus recorded the lowest value since November 2014 at RM1.6 billion .
- On a m-o-m basis, exports decreased RM4.3 billion or 5.0% from RM86.2 billion. In seasonally adjusted terms, exports decreased 11.0%.
- On a month-on-month (m-o-m) basis, imports grew RM2.4 billion (+3.0%) from RM77.8 billion. In seasonally adjusted terms, imports registered an increase of 4.0%.
- On a y-o-y basis, lower in exports were mainly to Japan (-RM1.4 billion), European Union (-RM745.3 million), Turkey (-RM542.7 million), Switzerland (-RM508.0 million) and India (-RM387.5 million).
- On a y-o-y basis, higher imports were mainly from China (+RM2.9 billion), Saudi Arabia (+RM1.8 billion), European Union (+RM1.3 billion), Taiwan (+RM1.3 billion) and Indonesia (+RM785.4 million).
TRADE
Total trade which was valued at RM162.0 billion expanded RM7.9 billion or 5.1% from a year ago. However,when compared to the previous month,it posted a decrease of RM2.0 billion or 1.2%. The trade surplus for August 2018 was RM1.6 billion, fell RM8.3 billion (-83.7%) from a year ago. It also posted a decrease of RM6.7 billion or 80.7% when compared to the previous month.
EXPORTS
On a y-o-y basis, exports decreased 0.3% from RM82.0 billion. The main products which contributed to the decrease were:
- Palm oil and palm oil-based products (6.2% of total exports), shrank RM1.5 billion (-22.9%) to RM5.1 billion. Exports of palm oil, the major commodity in this group of products declined RM1.0 billion or 26.8% due to the decrease in both export volume (-15.2%) and average unit value (-13.7%);
- Liquefied natural gas (LNG), which accounted for 3.9% of total exports decreased RM918.3 million or 22.5% to RM3.2 billion due to the decline in export volume (-28.6%) although average unit value increased 8.6%;
- Timber and timber-based products, which contributed 2.4% to total exports, recorded a drop of RM49.0 million or 2.4% to RM2.0 billion; and
- Natural rubber (0.4% of total exports) fell RM39.5 million or 10.5% to RM337.0 million due to the decrease in average unit value (-14.3%) although export volume grew 4.4%.
However, increases were recorded for the following products:
- Crude petroleum, which contributed 4.0% to total exports increased RM1.3 billion or 64.9% to RM3.3 billion due to the increase in both average unit value (+45.5%) and export volume (+13.4%);
- Electrical and electronic (E&E) products (39.2% of total exports), increased RM985.5 million (+3.2%) to RM32.0 billion; and
- Refined petroleum products, which accounted for 5.5% of total exports,grew RM232.2 million or 5.4% to RM4.5 billion due to the increase in average unit value(+29.1%) as export volume, decreased 18.4%.
On a m-o-m basis, exports fell RM4.3 billion (-5.0%) from RM86.2 billion. The main products which contributed to the decrease were:
- E&E products decreased RM2.5 billion (-7.1%) from RM34.5 billion;
- Refined petroleum products dropped RM953.1 million or 17.4% from RM5.5 billion due to the decrease in export volume (-20.0%) although average unit value increased 3.3%;
- Crude petroleum decreased RM528.2 million or 13.8% from RM3.8 billion due to the fall in export volume (-14.9%) as average unit value increased 1.2%; and
- Palm oil and palm oil-based products fell RM438.0 million or 8.0% from RM5.5 billion. Exports of palm oil decreased RM240.1 million or 8.0% due to the decrease in both export volume (-4.4%) and average unit value (-3.8%).
Nevertheless, the following products increased:
- LNG increased RM743.6 million (+30.7%) from RM2.4 billion due to the increase in both export volume (+18.6%) and average unit value (+10.3%);
- Timber and timber-based products increased RM63.8 million or 3.3% from RM1.9 billion; and
- Natural rubber grew RM2.2 million or 0.7% from RM334.8 million due to the growth in export volume (+2.1%) although average unit value dropped 1.4%.
Seasonally Adjusted Figure
On a m-o-m basis seasonally adjusted terms, exports decreased RM9.9 billion (-11.0%) to RM79.9 billion.
Exports, 2014-2018
IMPORTS
On a y-o-y basis, imports increased 11.2% to RM80.2 billion. The growth in imports by end use was mainly attributed to capital goods, intermediate goods and consumption goods.
- Capital Goods
Imports of capital goods, which accounted for 14.5% of total imports, rose RM2.3 billion (+25.3%) to RM11.7 billion due to the growth in both transport equipment, industrial (+RM1.2 billion, +180.2%) and capital goods (except transport equipment) (+RM1.1 billion, +13.1%).
- Intermediate Goods
These goods which constituted 56.1% of total imports increased RM1.9 billion (+4.3%) to RM45.0 billion. The increase was attributed to industrial supplies, processed (+RM2.3 billion, +14.5%), fuel & lubricants, primary (+RM2.2 billion, +126.4%) and parts & accessories of transport equipment (+RM778.0 million, +33.1%). However, decrease was recorded in parts and accessories of capital goods (except transport equipment) (-RM3.2 billion, -17.3%).
- Consumption Goods
Imports of consumption goods which constituted for 8.9% of total imports recorded an increase of RM888.0 million (+14.2%) to RM7.1 billion. The increase was mainly attributed to durables (+RM453.1 million, +57.9%), semi-durables (+RM344.4 million, +26.2%) and non-durables (+RM98.8 million, +6.3%).
On a m-o-m basis, imports rose RM2.4 billion or 3.0% from RM77.8 billion. The increase in imports by end use was contributed by intermediate goods, capital goods and consumption goods.
- Intermediate Goods
These goods increased RM5.1 billion (+12.8%) from RM39.9 billion. The main components contributing to the increase were parts & accessories of capital goods (except transport equipment) (+RM4.1 billion, +37.0%), fuel & lubricants, primary (+RM585.7 million, +17.3%) and parts & accessories of transport equipment (+RM467.8 million, +17.6%).
- Capital Goods
Imports of capital goods grew RM2.0 billion (+21.2%) from RM9.6 billion due to the increase in both capital goods (except transport equipment) (+RM1.6 billion, +19.3%) and transport equipment, industrial (+RM465.2 million, +32.7%).
- Consumption Goods
Imports of these goods registered an increase of RM466.7 million (+7.0%) from RM6.7 billion. This expansion was due to durables (+RM278.7 million, +29.1%) and semi-durables (+RM151.3 million, +10.0%).
Seasonally Adjusted Figure
On a m-o-m basis seasonally adjusted terms, imports increased RM3.1 billion (+4.0%) to RM78.9 billion.
Imports, 2014 - 2018
MARKET SHARE
The following charts show Malaysia's major trading partners for January - August 2018.
Total Trade by Major Countries, Jan – Aug 2018, percentage share
Exports and Imports by Major Countries, Jan – Aug 2018, percentage share
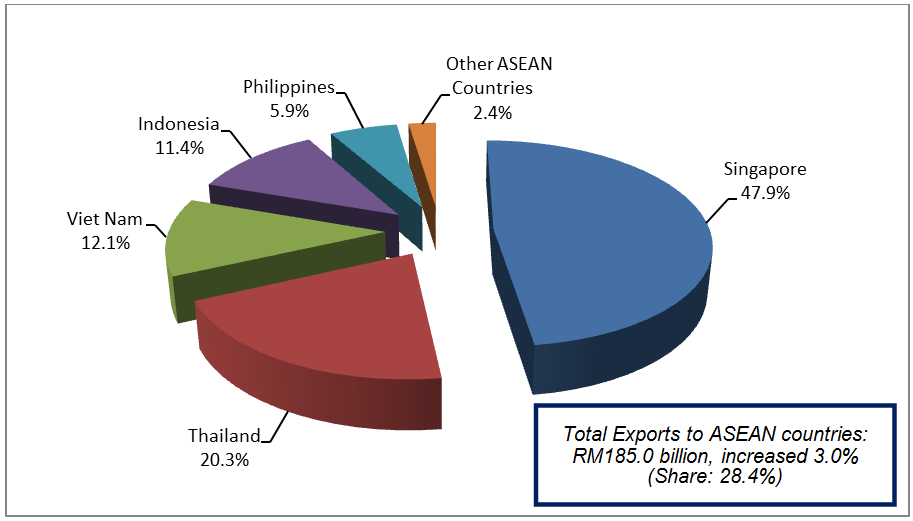
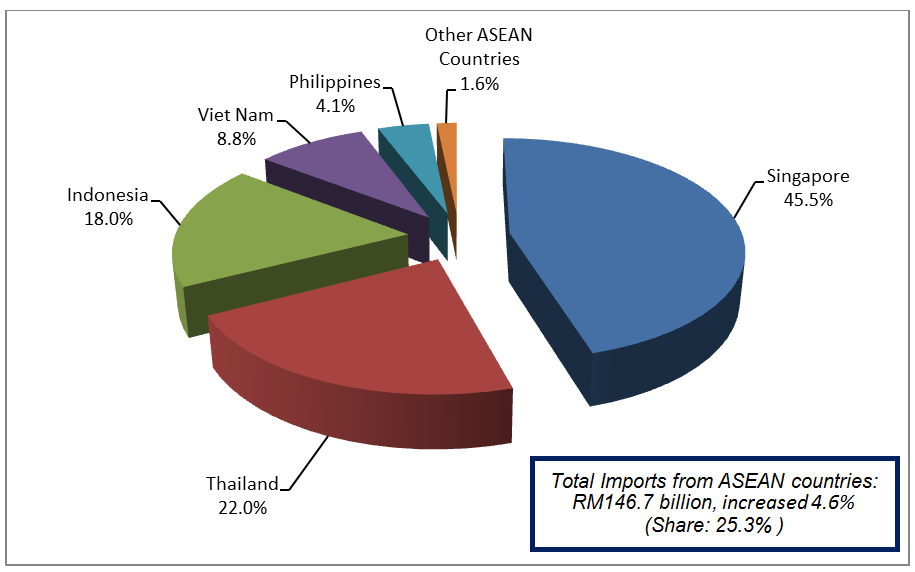
The following charts show Malaysia’s trade with ASEAN countries for January – August 2018.
Exports, Jan - Aug 2018, percentage share
Imports, Jan – Aug 2018, percentage share
Notes:
# The August 2018 data is provisional and subject to revision in later issues.
Released By:
DATO' SRI DR. MOHD UZIR MAHIDIN
CHIEF STATISTICIAN MALAYSIA
DEPARTMENT OF STATISTICS, MALAYSIA
![]() DrUzir_Mahidin
DrUzir_Mahidin ![]()
![]() Dr_Uzir
Dr_Uzir
05 OCTOBER 2018
Contact person:
Ho Mei Kei
Public Relation Officer
Strategic Communication and International Division
Department of Statistics, Malaysia
Tel : +603-8885 7942
Fax : +603-8888 9248
Email : mkho[at]dosm.gov.my
Subscribe
Newsletter
Subscribe to our newsletter and stay updated
For interviews, press statement and clarification to the media, contact:
Baharudin Mohamad
Public Relation Officer
Email: baharudin[at]dosm.gov.my
Phone: 03 8090 4681
Not found what you looking for? Request data from us, through
Go to eStatistik
Email: data[at]dosm.gov.my
Phone: 03 8885 7128 (data request)


