
Malaysia External Trade Statistics
- Home
- Statistics
- Economy
- External Sector
- Malaysia External Trade Statistics
Malaysia External Trade Statistics November 2014
Latest Release : 7 January 2015
Upcoming release : 19 March 2026
Overview
KEY FACT :
- On a year-on-year (y-o-y) basis, exports rose RM1.3 billion (+2.1%) to RM63.7 billion.
- On a y-o-y basis, imports increased by RM76.9 million (+0.1%) to RM52.6 billion.
- On a month-on-month (m-o-m) basis, exports fell RM1.3 billion (-2.0%) from RM65.1 billion. In seasonally adjusted terms, exports decreased 3.3%.
- On a m-o-m basis, imports also declined RM11.3 billion (-17.7%) from RM63.9 billion. In seasonally adjusted terms, imports dropped 17.4%.
- On a y-o-y basis, exports increased due to the rise in exports to Singapore (+RM1.4 billion), the United States of America (+RM767.3 million), Japan (+RM660.3 million), India (+RM600.5 million) and Thailand (+RM555.1 million).
- On a y-o-y basis, higher imports were mainly from the European Union (+RM941.5 million), Saudi Arabia (+RM489.0 million), the People’s Republic of China (+RM412.3 million), Kuwait (+RM329.7 million) and Norway (+RM302.1 million).
TRADE
Total trade in November 2014 which was valued at RM116.3 billion increased RM1.4 billion or 1.2% from the previous year. However, on a m-o-m basis, it registered a decrease of RM12.6 billion or 9.8%. On a y-o-y basis, the trade surplus rose RM1.2 billion or 12.6% to RM11.1 billion. It also recorded an increase of RM10.0 billion or 869.4% when compared with the previous month.
Total trade in November 2014 which was valued at RM116.3 billion increased RM1.4 billion or 1.2% from the previous year. However, on a m-o-m basis, it registered a decrease of RM12.6 billion or 9.8%. On a y-o-y basis, the trade surplus rose RM1.2 billion or 12.6% to RM11.1 billion. It also recorded an increase of RM10.0 billion or 869.4% when compared with the previous month.
EXPORTS
On a y-o-y basis, the 2.1% growth in exports was due to the rise of these products:
- Electrical and electronic (E&E) products, which accounted for 36.0% of total exports, expanded RM1.5 billion or 7.1% to RM23.0 billion;
- Crude petroleum (4.4% of total exports), grew RM312.6 million or 12.5% to RM2.8 billion due to the increase in export volume of 35.4% although average unit value dropped by 16.9%; and
- Timber and timber-based products, which contributed 2.7% to total exports, increased slightly by RM1.6 million or 0.1% to RM1.7 billion.
However, the following products declined in export value:
- Petroleum products, which accounted for 6.0% of total exports, fell RM718.8 million or 15.8% to RM3.8 billion due to the decrease in both average unit value (-8.3%) and export volume (-8.1%);
- Liquefied natural gas (LNG), which contributed 8.2% to total exports, dropped 7.3% or RM412.1 million to RM5.2 billion due to the decrease in export volume (-8.7%) as average unit value increased 1.5%;
- Palm oil and palm oil-based products (7.8% of total exports), decreased RM388.8 million or 7.2% to RM5.0 billion. Exports of palm oil, the major commodity in this group of products, fell RM558.4 million or 14.7% and this was attributed to the drop in both export volume (-9.6%) and average unit value (-5.6%); and
- Natural rubber (0.4% of total exports), declined 56.8% (-RM324.4 million) to RM246.9 million due to the decrease in both export volume (-37.0%) and average unit value (-31.4%).
Exports, 2010-2014
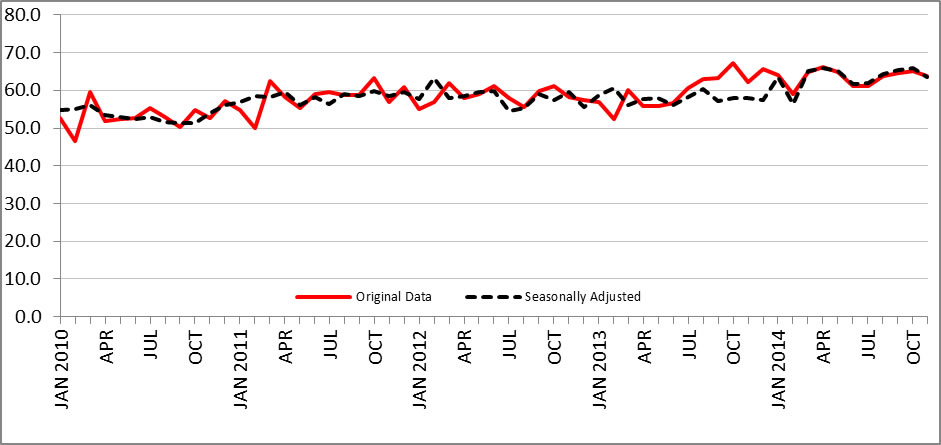
On a m-o-m basis, the 2.0% decline in exports was attributed to:
- Petroleum products, fell RM2.1 billion or 35.3% from RM5.9 billion due to the decrease in export volume (-36.0%) as average unit value grew 1.1%;
- Palm oil and palm oil-based products, declined RM845.3 million or 14.5% from RM5.8 billion. Exports of palm oil decreased RM585.4 million due to the drop in volume (-15.7%) as average unit value increased slightly by 0.6%;
- LNG, declined RM287.7 million or 5.2% from RM5.5 billion due to the drop in export volume (-8.4%) as average unit value rose 3.5%; and
- Natural rubber, declined RM47.9 million or 16.2% from RM294.8 million due to the 15.1% decrease in export volume and 1.3% drop in average unit value.
Nevertheless, the following products increased:
- E&E products, expanded RM1.6 billion (+7.4%) from RM21.4 billion;
- Timber and timber-based products, grew RM55.3 million or 3.4% from RM1.6 billion; and
- Crude petroleum rose RM42.9 million or 1.5% from RM2.8 billion due to the increase in export volume of 9.5% as average unit value dropped 7.3%.
Seasonally Adjusted Figure
- On a m-o-m basis seasonally adjusted terms, exports reduced RM2.2 billion (-3.3%) to RM63.6 billion.
IMPORTS
On a y-o-y basis, imports recorded increases with intermediate goods contributing the most followed by capital goods.
On a y-o-y basis, imports recorded increases with intermediate goods contributing the most followed by capital goods.
- Intermediate Goods
These goods which constituted 59.7% of total imports expanded RM1.0 billion (+3.4%) to RM31.4 billion, mainly contributed by the increase of RM1.3 billion (+11.5%) in industrial supplies, processed and RM810.7 million (+53.6%) in fuel & lubricants, primary.
- Capital Goods
Imports of these goods which represented 15.2% of total imports grew RM473.3 billion or 6.3% to RM8.0 billion due to the RM536.7 million (+8.4%) increase in capital goods (except transport equipment). However, imports of transport equipment, industrial dropped RM63.4 million (-5.5%).
- Consumption Goods
Imports of consumption goods which accounted for 7.7% of total imports declined RM71.3 million (-1.7%) to RM4.0 billion. The main components attributed to the decrease were semi-durables (-RM121.0 million, -17.6%) and transport equipment, non-industrial (-RM76.3 million, -49.6%).
Imports, 2010-2014
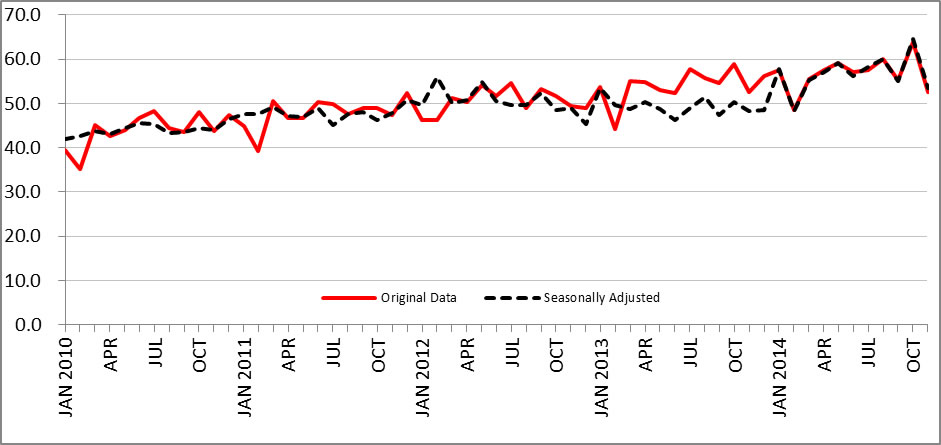
On a m-o-m basis, the reduction in imports was attributed to intermediate goods and consumption goods.
- Intermediate Goods
These goods decreased RM9.7 billion (-23.6%) from RM41.1 billion. The main components which contributed to the drop were parts & accessories of capital goods (except transport equipment) (-RM5.9 billion, -36.6%), fuel & lubricants, processed, others (-RM1.5 billion, -47.3%) and industrial supplies, processed (-RM904.9 million, -6.7%).
- Consumption Goods
Imports of consumption goods declined RM288.2 million (-6.6%) from RM4.3 billion. This was due to the drop in semi-durables (-RM161.3 million, -22.2%) and non-durables (-RM76.7 million, -7.0%).
- Capital Goods
Imports of capital goods rose RM267.2 million or 3.5% from RM7.7 billion due to the increase in transport equipment, industrial (+RM289.8 million, +35.8%). However, imports of capital goods (except transport equipment) shrank by 0.3% (-RM22.5 million).
Seasonally Adjusted Figure
On a m-o-m basis seasonally adjusted terms, imports decreased RM11.3 billion (-17.4%) to RM53.4 billion.
On a m-o-m basis seasonally adjusted terms, imports decreased RM11.3 billion (-17.4%) to RM53.4 billion.
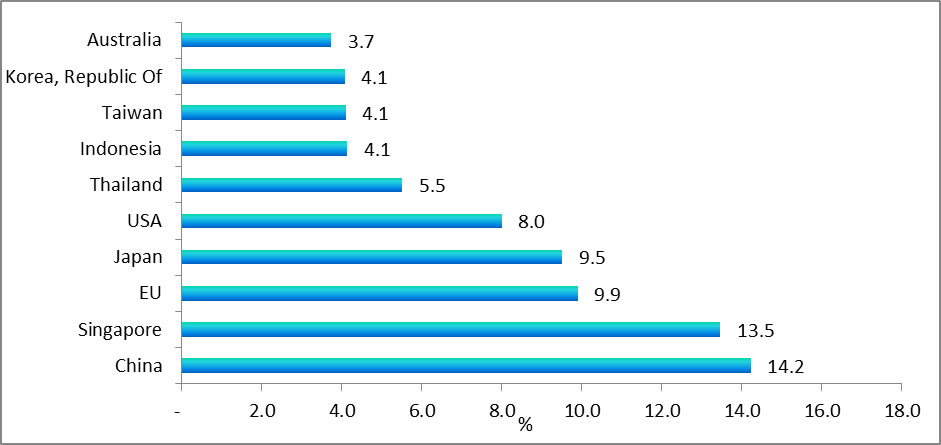
MARKET SHARE
The following charts show Malaysia's major trading partners for January - November 2014.
The following charts show Malaysia's major trading partners for January - November 2014.
Total Trade by Major Countries, Jan - Nov 2014, percentage share
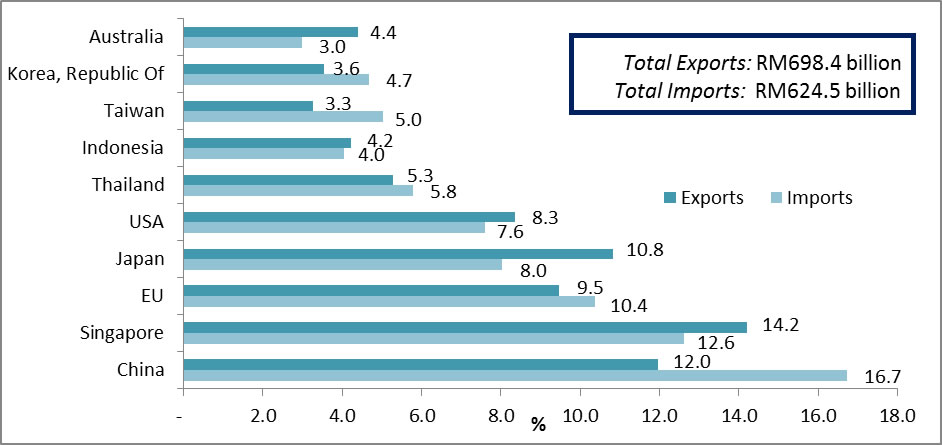
Exports and Imports by Major Countries, Jan - Nov 2014, percentage share
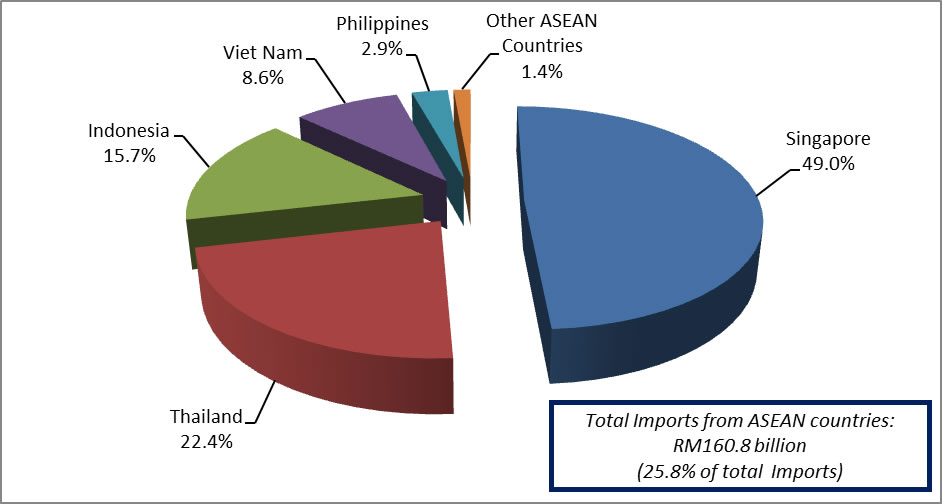
The following charts show Malaysia’s trade with ASEAN countries for January - November 2014.
Exports, Jan - Nov 2014, percentage share

Imports, Jan - Nov 2014, percentage share
*Notes:
- Data for November 2014 is provisional. The data will be updated based on the latest available figures and subsequently published in the December 2014 publication.
THE OFFICE OF CHIEF STATISTICIAN MALAYSIA
DEPARTMENT OF STATISTICS, MALAYSIA
7 January 2015
Contact person:
Norrita binti Amran
Public Relation Officer
Corporate and User Services Division
Department of Statistics, Malaysia
Tel : +603-8885 7942
Fax : +603-8888 9248
Email : norrita.amran@stats.gov.my
Subscribe
Newsletter
Subscribe to our newsletter and stay updated
For interviews, press statement and clarification to the media, contact:
Baharudin Mohamad
Public Relation Officer
Email: baharudin[at]dosm.gov.my
Phone: 03 8090 4681
Not found what you looking for? Request data from us, through
Go to eStatistik
Email: data[at]dosm.gov.my
Phone: 03 8885 7128 (data request)


