
Consumer Price Index
- Home
- Statistics
- Economy
- Prices
- Consumer Price Index
Consumer Price Index Malaysia September 2017
Consumer Price Index Malaysia August 2017 23 August 2017
Consumer Price Index Malaysia July 2017 19 July 2017
Consumer Price Index Malaysia June 2017 21 June 2017
Consumer Price Index Malaysia May 2017 17 May 2017
Consumer Price Index Malaysia April 2017 19 April 2017
Consumer Price Index Malaysia March 2017 Show all release archives
Overview

SUMMARY OF FINDINGS
The overall index for CPI rose at a higher rate of 4.3 per cent to 120.3 in September 2017 from 115.3 in the corresponding month of the preceding year. Among the major groups which recorded increases were the indices for Transport (+15.8 per cent), Food & Non-Alcoholic Beverages (+4.6 per cent), Furnishings, Household Equipment & Routine Household Maintenance (+2.8 per cent), Restaurants and Hotels (+2.6 per cent), Health (+2.5 per cent) and Housing, Water, Electricity, Gas & Other Fuels (+2.4 per cent). (Table 1)
Chart 1: Consumer Price Index: Index Number for Overall and Selected Main Groups

The index of transport group showed a significant increase of 15.8 per cent on a year-on-year basis in September 2017, after rising 11.7 per cent in August 2017. The average price of 1 litre of RON95 petrol was RM2.19 in September 2017 compared to RM1.70 in September 2016. As for RON97, the average price increased to RM2.48 in September 2017 compared to RM2.05 in September 2016. Fuels & lubricants for personal transport equipment accounted for 7.8 per cent of the CPI weights.
The index for Food & Non-Alcoholic Beverages which accounted 30.2 per cent in the CPI weights, increased 4.6 per cent in September 2017. The increase was driven by food sub-group index which comprised of Oils and Fats (+39.6 per cent), Fish & Seafood (+8.0 per cent), Vegetables (+4.8 per cent) and Fruits (+3.9 per cent). As for Food Away From Home index, it continued to rise in September 2017, an increase of 5.1 percent.
Chart 2: Consumer Price Index: Annual Percentage Change for Food & Non-Alcoholic Beverages

Among the index of food items which recorded notable increases in September 2017 compared to the same period of last year were Cooking Oil (+49.1 per cent),Choy Sum (+13.0 per cent), Indian Mackerel (Fish) (+11.0 per cent), Spinach (+10.9 per cent), Cuttlefish (+9.1 per cent), Hardtail Scad (Fish) (+6.8 per cent), Spanish Mackerel (Fish) (+6.8 per cent) and Round Cabbage (+6.7 per cent). Meanwhile, decreases were registered in the index of some food items such as Chicken (-3.5 per cent), Cucumber (-2.0 per cent) and French Bean (-1.2 per cent).
The increase in the index for Food & Non-Alcoholic Beverages was reflected in most states in Malaysia especially those in highly urbanised states such as Wilayah Persekutuan Kuala Lumpur, Selangor & Wilayah Persekutuan Putrajaya, Pulau Pinang, Johor and Melaka.
Chart 3: Consumer Price Index: Annual Percentage Change for Food & Non-Alcoholic Beverages by State

Six states recorded higher increases for Food & Non-Alcoholic Beverages index above the national level index for September 2017 compared with the corresponding month in 2016. The index for Food & Non-Alcoholic Beverages rose 5.8 per cent in Melaka, 5.3 per cent in Johor, 5.3 per cent in Sabah and Labuan, 5.2 per cent in Pulau Pinang, 5.0 per cent in Kedah & Perlis and 4.7 per cent in Wilayah Persekutuan Kuala Lumpur.
On a monthly basis, the index for Food & Non-Alcoholic Beverages remain unchanged at 130.1 in September 2017, after an increase of 0.4 per cent in August 2017. Meanwhile, the index for Non-Food increased 0.5 per cent in September 2017 compared with the preceding month.
Based on a seasonally adjusted term, the overall CPI for September 2017 increased 0.3 per cent compared to August 2017. (Table 1)
Core inflation rose 2.4 per cent in September 2017 compared with the same month of the previous year. Among the major groups which influenced the higher core rate were price increases of Food & Non-Alcoholic Beverages (+4.5 per cent), Housing, Water, Electricity, Gas & Other Fuels (+2.8 per cent), Furnishings, Household Equipment & Routine Household Maintenance (+2.8 per cent), Restaurants & Hotels (+2.6 per cent), Health (+2.5 per cent) and Transport (+2.1 per cent). (Table 3)
CPI changes for the period January – September 2017/2016
CPI for the period January to September 2017 registered an increase of 4.0 per cent compared with the same period last year. The index for Food & Non-Alcoholic Beverages was the main contributor to the rise in CPI for the period January to September 2017, registering an increase of 4.2 per cent. The increase was contributed by the index for Food Away From Home (+4.6 per cent) and Food At Home (+4.4 per cent). While, the index for Coffee, Tea, Cocoa & Non-Alcoholic Beverages decreased 0.4 per cent. Among the subgroups of Food At Home which showed significant increases during this period as shown in Table 2 were Oils & Fats (+39.0 per cent), Fish & Seafood (+6.6 per cent), Vegetables (+4.2 per cent), Fruits (+3.2 per cent) and Meat (+3.0 per cent).
Other major groups which contributed to the rise in CPI during this period were Transport (+13.9 per cent), Health (+2.6 per cent), Recreation Services & Culture (+2.4 per cent), Restaurants & Hotels (+2.4 per cent) and Housing, Water, Electricity, Gas & Other Fuels (+2.2 per cent).
Core inflation, which excludes most volatile items of fresh food, as well as administered prices of goods and services recorded changes ranging from 2.3 per cent to 2.6 per cent in the period January to September 2017 compared with the same period of the previous year.
Table 1: Consumer Price Index for Main Groups, Malaysia (2010=100)

Table 2: Consumer Price Index for Sub-Groups of Food and Non-Alcoholic Beverages, Malaysia (2010=100)
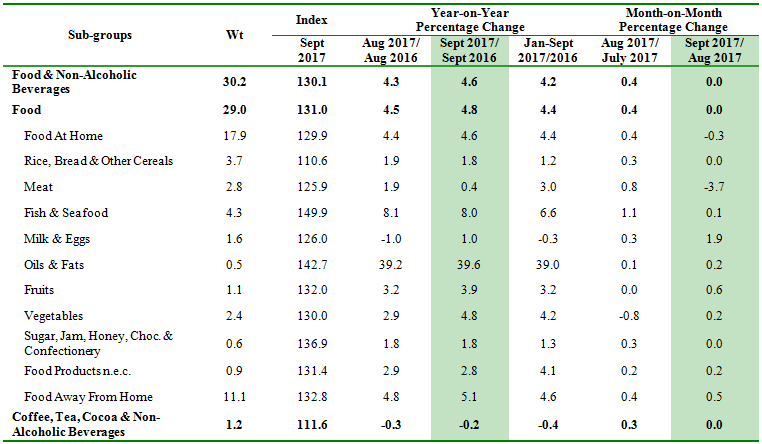
Table 3: Headline CPI and Core Index by Main Groups, Malaysia (2010=100)

Annex1
Average Price for Selected Items in Malaysia, August 2017 (RM)

Released By:
DR. MOHD UZIR MAHIDIN
CHIEF STATISTICIAN MALAYSIA
DEPARTMENT OF STATISTICS, MALAYSIA
20 October 2017
Contact person:
Ho Mei Kei
Public Relation Officer
Corporate and User Services Division
Department of Statistics, Malaysia
Tel : +603-8885 7942
Fax : +603-8888 9248
Email : mkho[at]stats.gov.my
Subscribe
Newsletter
Subscribe to our newsletter and stay updated
For interviews, press statement and clarification to the media, contact:
Baharudin Mohamad
Public Relation Officer
Email: baharudin[at]dosm.gov.my
Phone: 03 8090 4681
Not found what you looking for? Request data from us, through
Go to eStatistik
Email: data[at]dosm.gov.my
Phone: 03 8885 7128 (data request)


