
Consumer Price Index
- Home
- Statistics
- Economy
- Prices
- Consumer Price Index
Consumer Price Index Malaysia October 2012
Consumer Price Index Malaysia September 2012 19 September 2012
Consumer Price Index Malaysia August 2012 15 August 2012
Consumer Price Index Malaysia July 2012 18 July 2012
Consumer Price Index Malaysia June 2012 22 June 2012
Consumer Price Index Malaysia May 2012 23 May 2012
Consumer Price Index Malaysia April 2012 Show all release archives
Overview
Consumer Price Index Malaysia October 2012
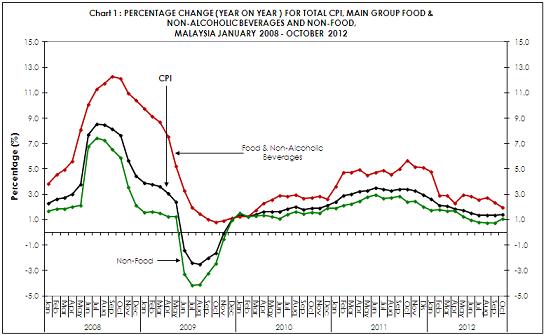
The Consumer Price Index (CPI) for the period January to October 2012 increased by 1.7 per cent to 104.8 compared with that of 103.0 in the same period last year. Compared with the same month in 2011, the CPI for October 2012 registered an increase of 1.3 per cent from 104.0 to 105.4 and when compared with the previous month, the CPI increased by 0.2 per cent.
The index for Food & Non-Alcoholic Beverages and Non-Food for the month of October 2012 showed increases of 2.0 and 1.1 per cent respectively as compared to the same month in 2011. For the period January to October 2012, the index for Food & Non-Alcoholic Beverages and Non-Food increased by 2.8 and 1.3 per cent respectively. Compared with the previous month, the index for Food & Non-Alcoholic Beverages and Non-Food increased by 0.4 and 0.1 per cent respectively (Table 1).
CPI changes for the period January - October 2012 / 2011
The 1.7 per cent increase in the CPI was brought about by increases observed in the indices for all the main groups except those of Communication ( - 0.7 per cent ) and Clothing & Footwear ( - 0.5 per cent ). Notable increases among these main groups with high weights were Food & Non-Alcoholic Beverages ( + 2.8 per cent ); Housing, Water, Electricity, Gas & Other Fuels ( + 1.7 per cent ) and Transport ( + 0.8 per cent ). Other increases were Restaurants & Hotels ( + 3.0 per cent ); Education ( + 2.5 per cent ); Miscellaneous Goods & Services ( + 2.2 per cent ); Furnishings, Household Equipment & Routine Household Maintenance ( + 2.1 per cent ): Health ( + 1.9 per cent ); Recreation Services & Culture ( + 1.5 per cent ) and Alcoholic Beverages & Tobacco ( + 0.1 per cent ).
Table 1 : CONSUMER PRICE INDEX FOR MAIN GROUPS, MALAYSIA (2010=100)
|
Group
|
Wt.
|
Index
|
% Change
|
||||||
|
Oct
2011 |
Sep |
Oct
2012 |
Jan - Oct
2011 |
Jan - Oct |
Oct 2012/
Sep 2012 |
Oct 2012/
Oct 2011 |
Jan - Oct 2012/ 2011
|
||
| TOTAL |
100.0
|
104.0
|
105.2
|
105.4
|
103.0
|
104.8
|
0.2
|
1.3
|
1.7
|
| Food & Non-Alcoholic Beverages |
30.3
|
106.3
|
108.0
|
108.4
|
104.5
|
107.4
|
0.4
|
2.0
|
2.8
|
| Alcoholic Beverages & Tobacco |
2.2
|
104.6
|
104.9
|
104.9
|
104.6
|
104.7
|
0.0
|
0.3
|
0.1
|
| Clothing and Footwear |
3.4
|
99.7
|
99.1
|
99.0
|
99.8
|
99.3
|
-0.1
|
-0.7
|
-0.5
|
| Housing, Water, Electricity, Gas & Other Fuels |
22.6
|
102.3
|
103.8
|
103.8
|
101.6
|
103.3
|
0.0
|
1.5
|
1.7
|
| Furnishings, Household Equip. & Routine Household Maintenance |
4.1
|
102.3
|
104.3
|
104.2
|
101.6
|
103.7
|
-0.1
|
1.9
|
2.1
|
| Health |
1.3
|
103.6
|
105.4
|
105.5
|
102.6
|
104.6
|
0.1
|
1.8
|
1.9
|
| Transport |
14.9
|
104.8
|
105.6
|
105.6
|
104.3
|
105.1
|
0.0
|
0.8
|
0.8
|
| Communication |
5.7
|
99.5
|
98.9
|
98.8
|
99.8
|
99.1
|
-0.1
|
-0.7
|
-0.7
|
| Recreation Services & Culture |
4.6
|
103.0
|
103.1
|
103.1
|
101.7
|
103.2
|
0.0
|
0.1
|
1.5
|
| Education |
1.4
|
102.5
|
104.8
|
104.8
|
102.1
|
104.7
|
0.0
|
2.2
|
2.5
|
| Restaurants and Hotels |
3.2
|
107.1
|
109.5
|
109.7
|
105.6
|
108.8
|
0.2
|
2.4
|
3.0
|
| Miscellaneous Goods & Services |
6.3
|
103.5
|
104.9
|
105.0
|
102.1
|
104.3
|
0.1
|
1.4
|
2.2
|
| Non-Food |
69.7
|
103.0
|
104.0
|
104.1
|
102.3
|
103.7
|
0.1
|
1.1
|
1.3
|
| Durable Goods |
6.5
|
101.1
|
100.1
|
100.1
|
100.6
|
100.3
|
0.0
|
-1.0
|
-0.3
|
| Semi-Durable Goods |
4.4
|
100.4
|
100.0
|
99.8
|
100.3
|
100.1
|
-0.2
|
-0.6
|
-0.2
|
| Non-Durable Goods |
41.6
|
105.4
|
106.4
|
106.5
|
104.2
|
105.9
|
0.1
|
1.0
|
1.6
|
| Services |
47.5
|
103.5
|
105.4
|
105.6
|
102.5
|
104.9
|
0.2
|
2.0
|
2.3
|
Based on the above changes and the weights assigned to the main groups, the relative contribution to the overall increase of 1.7 per cent in the CPI can be identified as shown in Table 2. The three main groups, Food & Non-Alcoholic Beverages; Housing, Water, Electricity, Gas & Other Fuels and Transport together accounted for 77.9 per cent of the overall increase recorded for the current period.
Table 2 : CONTRIBUTION TO THE CHANGES IN THE OVERALL CONSUMER PRICE INDEX
BY MAIN GROUPS, MALAYSIA (2010=100)
|
Group
|
Wt.
|
2011 / 2010
|
October
2012 / 2011 |
January - October
2012 / 2011 |
|||
|
% Change
|
% Contribution
|
% Change
|
% Contribution
|
% Change
|
% Contribution
|
||
| TOTAL |
100.0
|
3.2
|
100.0
|
1.3
|
100.0
|
1.7
|
100.0
|
| Food & Non-Alcoholic Beverages |
30.3
|
4.8
|
46.4
|
2.0
|
47.1
|
2.8
|
51.1
|
| Alcoholic Beverages & Tobacco |
2.2
|
4.6
|
3.2
|
0.3
|
0.4
|
0.1
|
0.1
|
| Clothing and Footwear |
3.4
|
-0.2
|
-0.3
|
-0.7
|
-1.7
|
-0.5
|
-0.9
|
| Housing, Water, Electricity, Gas & Other Fuels |
22.6
|
1.8
|
12.5
|
1.5
|
25.3
|
1.7
|
20.6
|
|
Furnishings, Household Equip. & Routine Household Maintenance
|
4.1
|
1.8
|
2.3
|
1.9
|
5.5
|
2.1
|
4.7
|
| Health |
1.3
|
2.7
|
1.2
|
1.8
|
1.9
|
1.9
|
1.5
|
| Transport |
14.9
|
4.4
|
20.7
|
0.8
|
8.7
|
0.8
|
6.2
|
| Communication |
5.7
|
-0.3
|
-0.5
|
-0.7
|
-3.1
|
-0.7
|
-2.2
|
| Recreation Services & Culture |
4.6
|
2.0
|
2.8
|
0.1
|
0.3
|
1.5
|
3.6
|
| Education |
1.4
|
2.2
|
1.0
|
2.2
|
2.4
|
2.5
|
2.0
|
| Restaurants and Hotels |
3.2
|
5.9
|
6.0
|
2.4
|
6.1
|
3.0
|
5.9
|
| Miscellaneous Goods & Services |
6.3
|
2.4
|
4.7
|
1.4
|
7.1
|
2.2
|
7.4
|
The 2.8 per cent increase in the index for Food & Non-Alcoholic Beverages was the result of increases for Food At Home ( + 2.3 per cent ); Food Away From Home ( + 3.9 per cent ) and Coffee, Tea, Cocoa & Non-Alcoholic Beverages ( + 2.9 per cent ). Among the subgroups of Food At Home which showed significant increases during this period were Fish & Seafood ( + 7.3 per cent ); Milk & Eggs ( + 3.0 per cent ); Sugar, Jam, Honey, Chocolate and Confectionery ( + 2.7 per cent ); Fruits ( + 2.6 per cent ); Rice, Bread and Other Cereals ( + 1.1 per cent ) and Oils & Fats ( + 0.8 per cent ).
Table 3 : CONSUMER PRICE INDEX FOR SUB-GROUPS OF FOOD AND
NON-ALCOHOLIC BEVERAGES, MALAYSIA (2010=100)
|
Sub-group
|
Wt.
|
Index
|
% Change
|
||||||
|
Oct
2011 |
Sep
2012 |
Oct
2012 |
Jan - Oct 2011
|
Jan - Oct 2012
|
Oct 2012/
Sep 2012 |
Oct 2012/
Oct 2011 |
Jan - Oct 2012/2011
|
||
| Food & Non-Alcoholic Beverages |
30.3
|
106.3
|
108.0
|
108.4
|
104.5
|
107.4
|
0.4
|
2.0
|
2.8
|
| Food |
28.9
|
106.5
|
108.1
|
108.6
|
104.6
|
107.6
|
0.5
|
2.0
|
2.9
|
|
Food At Home
|
18.9
|
106.6
|
107.7
|
108.2
|
104.8
|
107.2
|
0.5
|
1.5
|
2.3
|
| Rice, Bread & Other Cereals |
4.4
|
101.7
|
102.5
|
102.7
|
101.3
|
102.4
|
0.2
|
1.0
|
1.1
|
| Meat |
2.9
|
113.2
|
107.1
|
110.1
|
107.6
|
106.0
|
2.8
|
-2.7
|
-1.5
|
| Fish & Seafood |
4.5
|
106.8
|
114.2
|
112.0
|
105.1
|
112.8
|
-1.9
|
4.9
|
7.3
|
| Milk & Eggs |
1.8
|
107.2
|
108.4
|
109.5
|
105.5
|
108.7
|
1.0
|
2.1
|
3.0
|
| Oils and Fats |
0.6
|
100.9
|
101.3
|
101.4
|
100.5
|
101.3
|
0.1
|
0.5
|
0.8
|
| Fruits |
1.2
|
106.4
|
109.5
|
109.8
|
105.6
|
108.3
|
0.3
|
3.2
|
2.6
|
| Vegetables |
2.1
|
105.7
|
102.9
|
104.9
|
105.4
|
103.3
|
1.9
|
-0.8
|
-2.0
|
| Sugar, Jam, Honey, Choc. & Confectionery |
0.6
|
113.3
|
113.8
|
118.7
|
111.1
|
114.1
|
4.3
|
4.8
|
2.7
|
| Food Products n.e.c. |
0.8
|
108.3
|
110.1
|
110.0
|
105.4
|
110.1
|
-0.1
|
1.6
|
4.5
|
| Food Away From Home |
10.0
|
106.2
|
109.0
|
109.3
|
104.2
|
108.3
|
0.3
|
2.9
|
3.9
|
| Coffee, Tea, Cocoa & Non-Alcoholic Beverages |
1.4
|
103.3
|
105.9
|
106.1
|
102.2
|
105.2
|
0.2
|
2.7
|
2.9
|
Monthly Changes for CPI
Compared with the previous month, the CPI for October 2012 increased by 0.2 per cent. Increases were for main groups Food & Non-Alcoholic Beverages ( + 0.4 per cent ); Restaurants & Hotels ( + 0.2 per cent ); Health and Miscellaneous Goods & Services by 0.1 per cent respectively. On the other hand, decreases were for Clothing & Footwear; Furnishings, Household Equipment & Routine Household Maintenance and Communication by 0.1 per cent respectively. The indices for Alcoholic Beverages & Tobacco; Housing, Water, Electricity, Gas & Other Fuels; Transport; Recreation Services & Culture and Education remained unchanged at 104.9; 103.8; 105.6; 103.1 and 104.8 respectively.
The 0.4 per cent increase in the index for Food & Non-Alcoholic Beverages in October 2012 compared with that of the previous month was the result of increases in the index for Food At Home ( + 0.5 per cent ); Food Away From Home ( + 0.3 per cent ) as well as Coffee, Tea, Cocoa & Non-Alcoholic Beverages ( + 0.2 per cent ).
Among the food items which recorded notable increases in October 2012 compared with the previous month were Red Chillies ( + 14.1 per cent ); Cucumber ( + 12.2 per cent ); Tomatoes ( + 12.1 per cent ); White Sugar ( + 8.2 per cent ); Chicken ( + 5.5 per cent ); Choy Sum ( + 5.5 per cent ); Hen’s Eggs ( + 4.1 per cent ); Spinach ( + 2.6 per cent ); Water Spinach ( + 2.3 per cent ) and Round Cabbage ( + 1.1 per cent ).
Meanwhile, the index of some food items decreased in October 2012 compared with the previous month. Among these were Hardtail Scad (Fish) ( - 5.3 per cent ); Indian Mackerel (Fish) ( - 3.8 per cent ); Threadfin Bream (Fish) ( - 3.5 per cent ); Spanish Mackerel (Fish) ( - 3.4 per cent ); Garlic ( - 2.5 per cent ); Cuttlefish ( - 2.2 per cent ); Long Beans ( - 2.0 per cent ); Round Scad (Fish) ( - 1.7 per cent ) and Watermelon ( - 1.1 per cent ).
A reclassification of items according to their durability and services rendered showed increases in Services ( + 0.2 per cent ) and Non-Durable Goods ( + 0.1 per cent ). The index for Semi-Durable Goods decreased by 0.2 while Durable Goods remained unchanged at 100.1.
Subscribe
Newsletter
Subscribe to our newsletter and stay updated
For interviews, press statement and clarification to the media, contact:
Baharudin Mohamad
Public Relation Officer
Email: baharudin[at]dosm.gov.my
Phone: 03 8090 4681
Not found what you looking for? Request data from us, through
Go to eStatistik
Email: data[at]dosm.gov.my
Phone: 03 8885 7128 (data request)


