
Consumer Price Index
- Home
- Statistics
- Economy
- Prices
- Consumer Price Index
Consumer Price Index Malaysia January 2018
Consumer Price Index Malaysia December 2017 20 December 2017
Consumer Price Index Malaysia November 2017 24 November 2017
Consumer Price Index Malaysia October 2017 20 October 2017
Consumer Price Index Malaysia September 2017 20 September 2017
Consumer Price Index Malaysia August 2017 23 August 2017
Consumer Price Index Malaysia July 2017 Show all release archives
Overview

Commencing January 2018, the Malaysia’s Consumer Price Index using the basket of goods and services that has been updated based on the Household Expenditure Survey 2016. The new basket comprises 552 items. Updating of the basket of goods and services aims to ensure the statistics reflect the current patterns in consumer expenditure.
SUMMARY OF FINDINGS
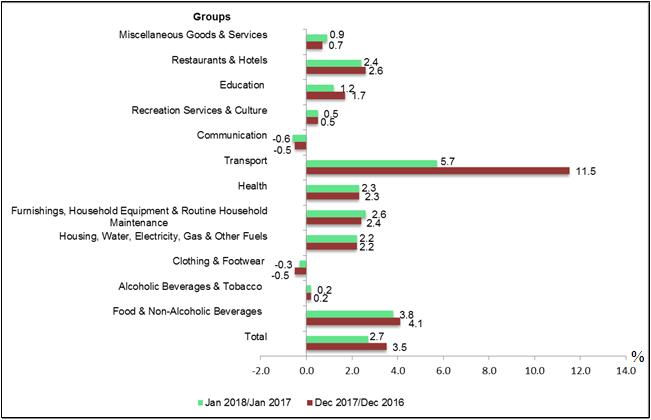
The overall index for CPI increased by 2.7 per cent in January 2018 as compared to the corresponding month of the preceding year. The increase in the index was due to higher prices in ten main groups, i.e Transport (+5.7 per cent), Food & Non-Alcoholic Beverages (+3.8 per cent), Furnishings, Household Equipment & Routine Household Maintenance (+2.6 per cent), Restaurants and Hotels (+2.4 per cent), Health (+2.3 per cent), Housing, Water, Electricity, Gas & Other Fuels (+2.2 per cent), Education (+1.2 per cent), Miscellaneous Goods & Services (+0.9 per cent), Recreation Services & Culture (+0.5 per cent) and Alcoholic Beverages & Tobacco (+0.2 per cent). (Chart 1)
On a monthly basis, CPI rose by 0.3 per cent as compared to December 2017.
Chart 1: Consumer Price Index (2010=100): Percentage Change by Main Groups, Malaysia, January 2018/January 2017
Index for Sub-Groups Food and Non-Alcoholic Beverages
The overall index for Food & Non-Alcoholic Beverages which accounted 29.5 per cent in the CPI weights, increased 3.8 per cent in January 2018. The increase was driven by food sub-group index which comprised of Vegetables (+7.6 per cent), Fish & Seafood (+5.0 per cent), Milk & Eggs (+2.5 per cent), Fruits (+2.2 per cent) and Sugar, Jam, Honey, Chocolate & Confectionery (+2.2 per cent). As for Food Away From Home index, it continued to rise in January 2018, an increase of 4.9 per cent.
Table 1: Consumer Price Index (2010=100): Annual Percentage Change by Sub-Groups Food & Non-Alcoholic Beverages, Malaysia, January 2018/January 2017

Among the index of food items which recorded notable increases in January 2018 as compared to the same period of last year were Spinach (+36.2 per cent), Long Beans (+33.6 per cent), Choy Sum (+23.7 per cent), Cuttlefish (+11.1 per cent), Hen’s Eggs (+6.5 per cent), Hardtail Scad (Fish) (+4.4 per cent), Meat (+4.2 per cent), Indian Mackerel (Fish)(+2.8 per cent), Chicken (+1.7 per cent) and Spanish Mackerel (Fish) (+1.5 per cent). Meanwhile, decreases were registered in the index of some food items such as Round Cabbage (-21.1 per cent) and Watermelon (-3.3 per cent).
States Index
In terms of overall CPI, four states surpassed the national CPI rate of 2.7 per cent recorded in January 2018 as compared to January 2017. The states are Melaka (+3.0 per cent), Johor (+2.9 per cent), Selangor & Wilayah Persekutuan Putrajaya (+2.9 per cent) and Negeri Sembilan (+2.8 per cent).
Meanwhile, the higher increase in the index for Food & Non-Alcoholic Beverages was reflected in most states in Malaysia. Five states recorded higher increases for Food & Non-Alcoholic Beverages index above the national index level (+3.8 per cent) for January 2018 as compared with the corresponding month in 2017. The index for Food & Non-Alcoholic Beverages rose 5.4 per cent in Wilayah Persekutuan Kuala Lumpur, 4.2 per cent in Melaka, 4.2 per cent in Selangor & Wilayah Persekutuan Putrajaya, 4.2 per cent di Sabah & Wilayah Persekutuan Labuan and 4.0 per cent in Johor. (Chart 2)
Chart 2: Consumer Price Index (2010=100): Annual Percentage Change for Food & Non-Alcoholic Beverages by State, January 2018/January 2017

Core Index
Core inflation rose 2.2 per cent in January 2018 as compared with the same month of the previous year. Among the major groups which influenced the higher core rate were price increases of Food & Non-Alcoholic Beverages (+3.5 per cent), Furnishings, Household Equipment & Routine Household Maintenance (+2.6 per cent), Housing, Water, Electricity, Gas & Other Fuels (+2.5 per cent), Restaurants & Hotels (+2.4 per cent), Health (+2.3 per cent) and Transport (+2.0 per cent). Core inflation differs from overall CPI (headline CPI) where the former is calculated by excluding prices for goods and services that are subject to fluctuations which considered transitory in nature and do not have a lasting impact on the underlying trend in inflation. These include nine of the CPI's most volatile items of fresh food, as well as administered prices of goods and services.
Table 2: Consumer Price Index (2010=100): Percentage Change of Headline CPI and Cote Index by Main Groups, Malaysia, January 2018/January 2017

Annex1
Average Price for Selected Items in Malaysia, January 2018 (RM)

Released By:
DATO' SRI DR. MOHD UZIR MAHIDIN
CHIEF STATISTICIAN MALAYSIA
DEPARTMENT OF STATISTICS, MALAYSIA
28 February 2018
Contact person:
Ho Mei Kei
Public Relation Officer
Strategic Communication and International Division
Department of Statistics, Malaysia
Tel : +603-8885 7942
Fax : +603-8888 9248
Email : mkho[at]stats.gov.my
Subscribe
Newsletter
Subscribe to our newsletter and stay updated
For interviews, press statement and clarification to the media, contact:
Baharudin Mohamad
Public Relation Officer
Email: baharudin[at]dosm.gov.my
Phone: 03 8090 4681
Not found what you looking for? Request data from us, through
Go to eStatistik
Email: data[at]dosm.gov.my
Phone: 03 8885 7128 (data request)


