
Micro, Small & Medium Enterprises (MSMEs) Performance
- Home
- Statistics
- Economy
- National Accounts
- Micro, Small & Medium Enterprises (MSMEs) Performance
Small and Medium Enterprises (SMEs) Performance 2020
Small and Medium Enterprises (SMEs) Performance 2019 31 July 2019
Small and Medium Enterprises (SMEs) Performance 2018 3 August 2018
Small and Medium Enterprises (SMEs) Performance 2017 21 September 2017
Small and Medium Enterprises Gross Domestic Product (SMEs GDP) 2016 23 September 2016
Small and Medium Enterprises 2015 11 September 2015
Small and Medium Enterprises 2014 Show all release archives
Overview
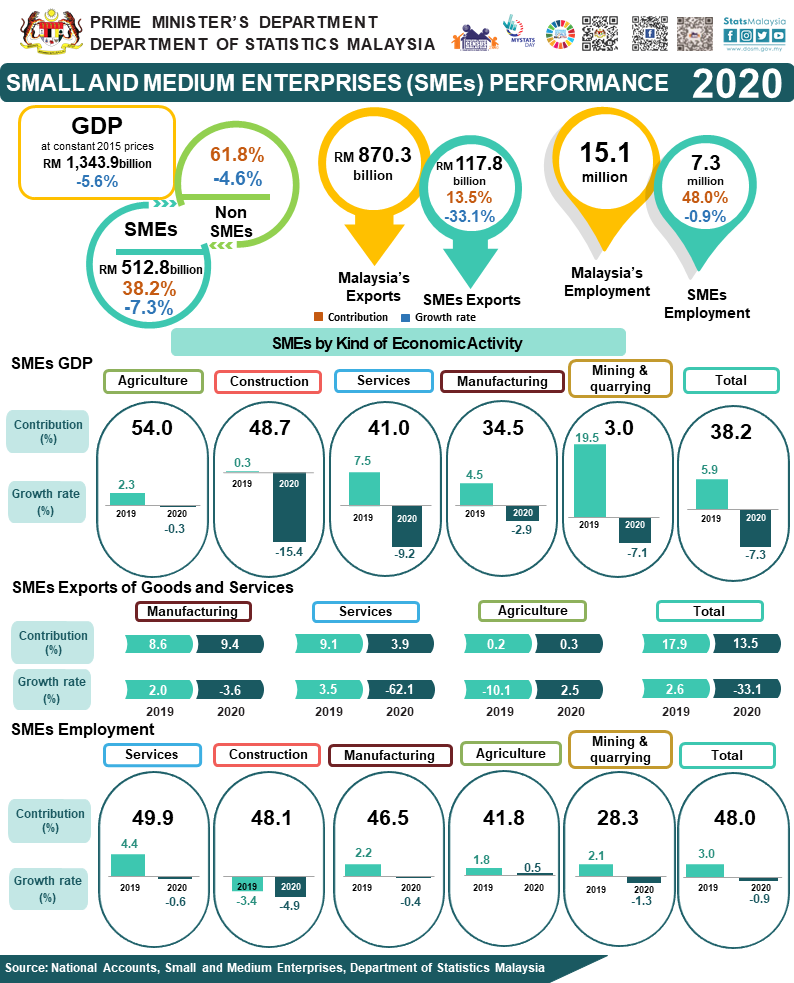
PERFORMANCE OF SMEs GDP 2020
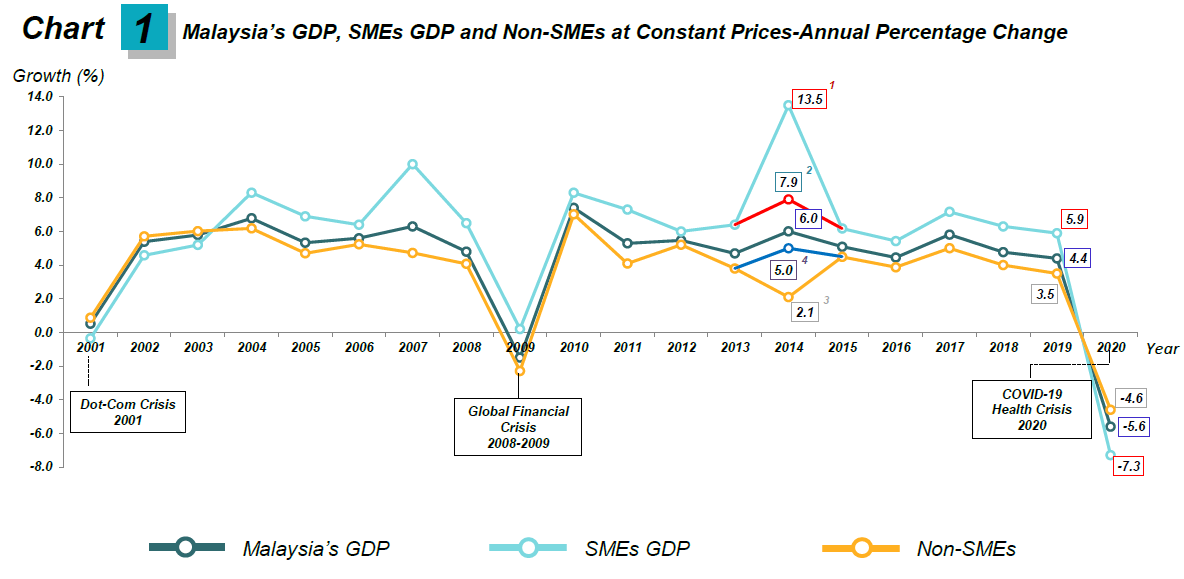
Based on the time series of Malaysia’s GDP and SMEs GDP, the growth of SMEs GDP is usually higher than Malaysia’s GDP. However, in 2020, the growth of SMEs' GDP registered at negative 7.3 percent, which was lower than Malaysia's GDP for the first time over the past 17 years since 2003 (Chart 1).
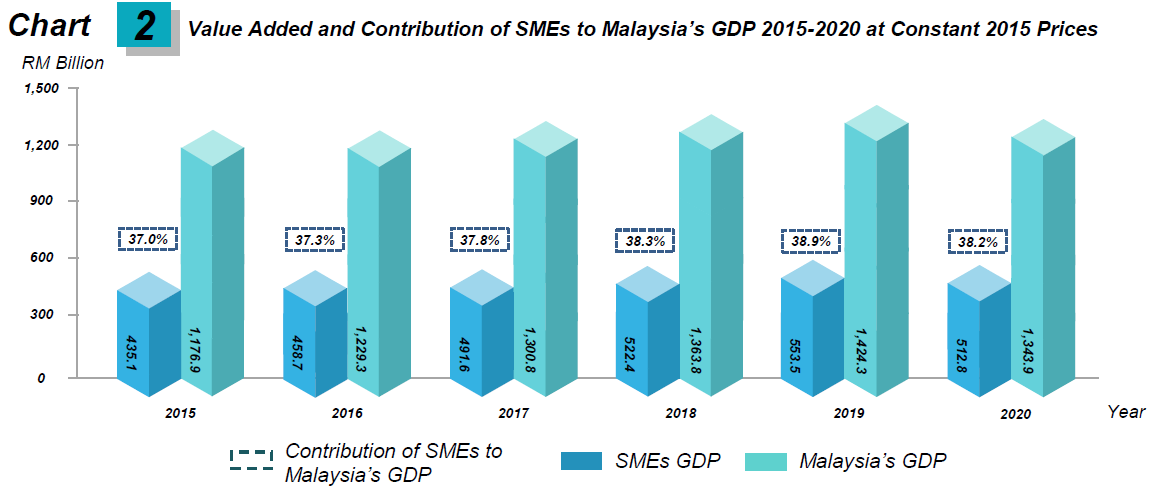
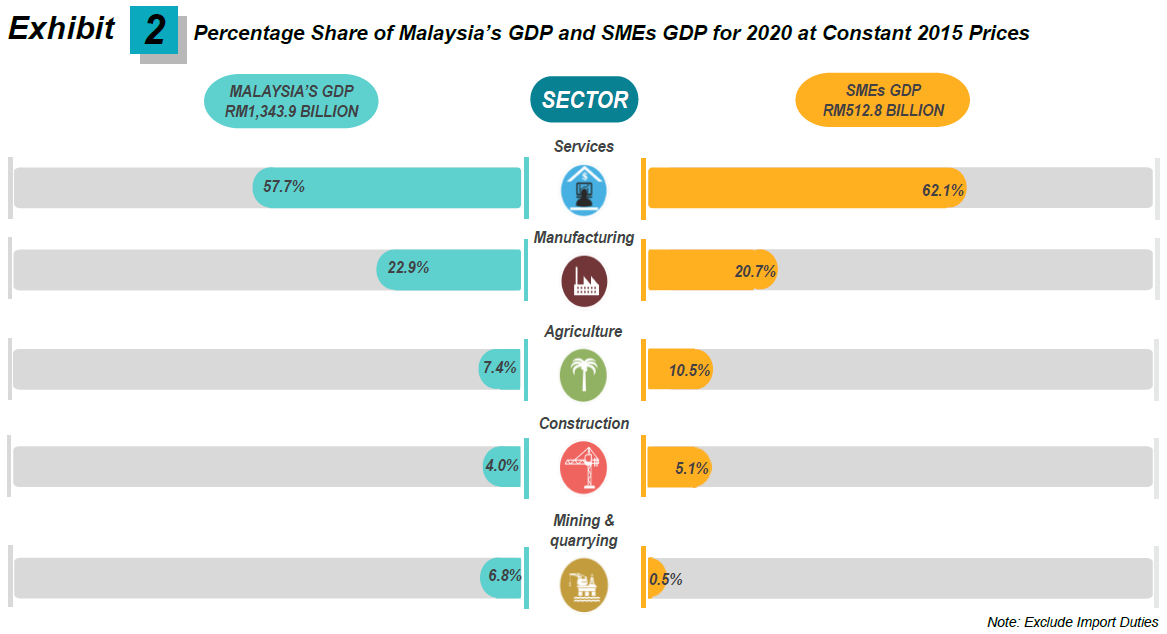
The contribution of SMEs GDP eased to 38.2 per cent in 2020 with a value added of RM512.8 billion as against 38.9 per cent (value added: RM553.5 billion) in the preceding year (Chart 2). Services and Manufacturing sectors remained as the main drivers of SMEs GDP activities which both sectors represent more than 80 per cent to SMEs GDP.
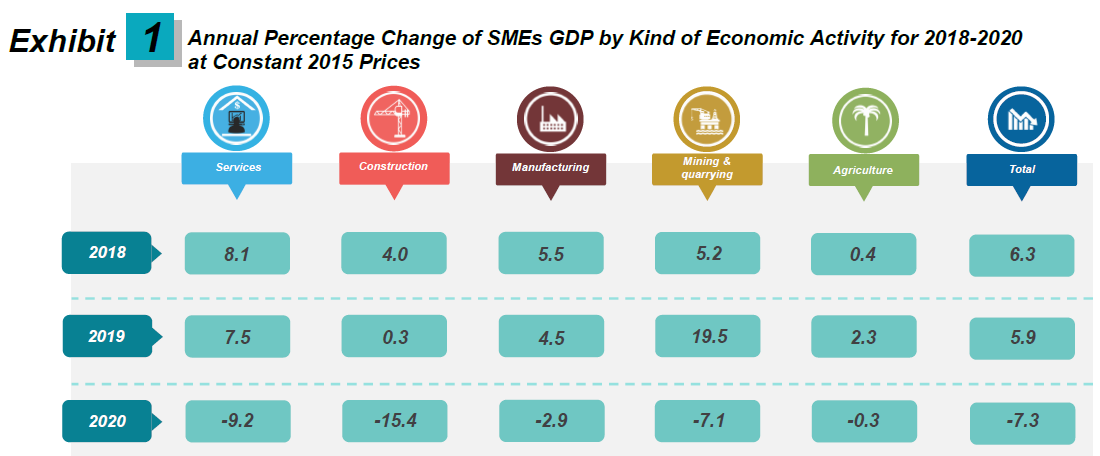
SMEs value added for Services sector decreased 9.2 per cent in 2020 from 7.5 per cent in the preceding year as shown in Exhibit 1. The sluggish momentum was due to the decline in Wholesale & retail trade, food & beverages and accommodation sub-sector which posted a negative growth at 7.8 per cent (2019: 7.7%). Finance, insurance, real estate and business services sub-sector also recorded a decrease in 2020 to negative 10.6 per cent (2019: 7.8%). Concurrently, Transportation & storage and information & communication sub-sector was affected by the pandemic COVID-19, contracted 11.4 per cent (2019: 6.6%) especially on land transport activity. Meanwhile, Information & communication activity remained positive in 2020.
Furthermore, SMEs in Construction sector decreased 15.4 per cent as compared to 0.3 per cent in the previous year due to the decline in all sub-sectors. For Manufacturing sector, value added of SMEs registered a negative growth of 2.9 per cent, dropped from 4.5 per cent in 2019. The decline was attributed by Non metallic mineral products, basic metal and fabricated metal products which plummeted 13.1 per cent (2019: 4.9%). In the meantime, Petroleum, chemical, rubber and plastic products continued recording a positive growth at 3.2 per cent (2019: 4.3%). This was followed by Food, beverages and tobacco products which remained positive growth at 2.0 per cent (2019: 3.2%).
Meanwhile, value added of SMEs in Mining & quarrying sector narrowed to 7.1 per cent from 19.5 per cent in 2019. Similarly, in Agriculture sector, value added of SMEs decreased to 0.3 per cent (2019: 2.3%). The decrease was attributed to the decline in all sub-sectors except for Livestock and Other agriculture which continued with a positive growth.
DISTRIBUTION BY KIND OF ECONOMIC ACTIVITY
Services sector remained as the largest contributor in SMEs activities with a share of 62.1 per cent followed by Manufacturing sector with 20.7 per cent as shown in Exhibit 2. Agriculture sector contributed 10.5 per cent to SMEs GDP. Meanwhile, Construction and Mining & quarrying sectors contributed 5.1 per cent and 0.5 per cent respectively.
CONTRIBUTION BY KIND OF ECONOMIC ACTIVITY
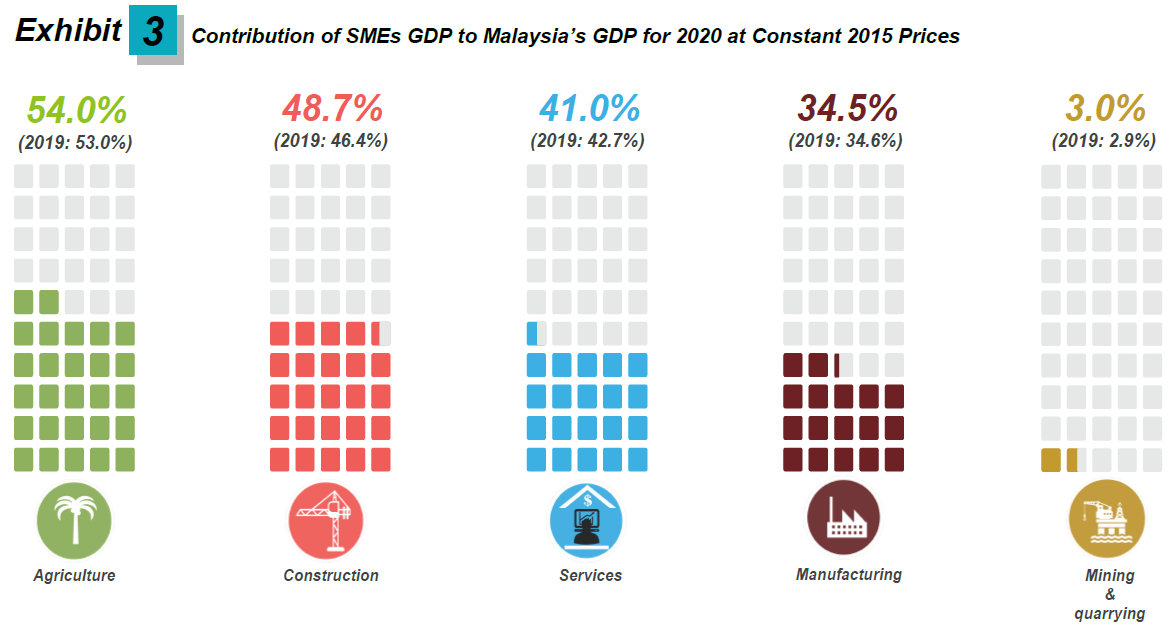
In terms of SMEs GDP contribution by kind of economic activity, all sectors recorded an increase in 2020 except for Services and Manufacturing sectors. Agriculture sector continued to dominate SMEs GDP with a share of 54.0 per cent (2019: 53.0%), driven by Rubber, oil palm, livestock and other agriculture sub-sector as portrayed in Exhibit 3. Contribution of SMEs GDP for Construction sector expanded to 48.7 per cent as compared to 46.4 per cent in 2019.
SMEs GDP of Services sector decreased to 41.0 per cent from 42.7 per cent in the preceding year, influenced by Wholesale & retail trade, food & beverage and accommodation sub-sector. Manufacturing sector registered a share of 34.5 per cent (2019: 34.6%) to SMEs GDP supported by Petroleum, chemical, rubber and plastic products. Meanwhile, SMEs GDP in Mining & quarrying sector recorded a share of 3.0 per cent (2019: 2.9%).
PERFORMANCE OF SMEs EXPORTS 2020
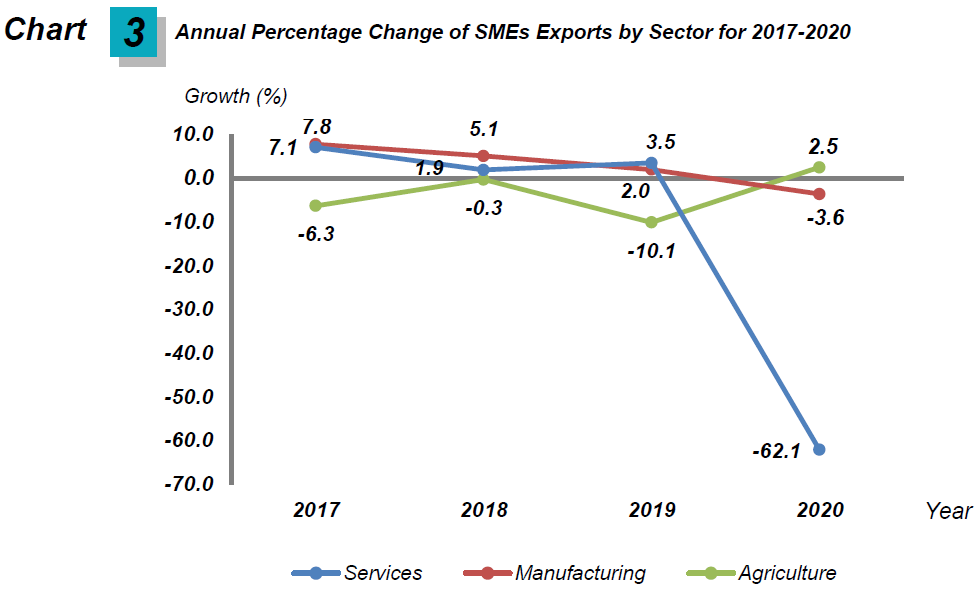
Exports of SMEs registered a decline of 33.1 per cent to RM117.8 billion in 2020 as compared to a growth of 2.6 per cent in 2019, attributed by Services (-62.1%) and Manufacturing (-3.6%) sectors as portrayed in Chart 3. Nevertheless, SMEs exports of Agriculture sector rose 2.5 per cent which amounted to RM2.3 billion in 2020, reflected in the increase in SMEs exports for vegetables, fisheries, poultry, banana and durian.
Meanwhile, Manufacturing sector contributed 69.3 per cent towards the total exports of SMEs in 2020, supported by Miscellaneous manufactured articles, manufactured goods and machinery & transport equipment. The main destination for SMEs exports of the Manufacturing sector was Singapore which constituted 20.6 per cent, followed by China (12.3%) and the United States (7.4%). SMEs exports of Services sector declined to RM33.9 billion as compared to RM89.3 billion in 2019, led by travel, transport and other business services activities.
The contribution of SMEs exports to the total exports in 2020 was 13.5 per cent consisted of Manufacturing (9.4%), Services (3.9%) and Agriculture (0.3%) sectors.
Exports of durian (includes fresh, frozen, pulp and paste) registered an increase of 34.6 per cent in 2020 to RM570.8 million as compared to RM424.1 million in 2019. The main destinations in 2020 were China (70.3%), Singapore (8.3%) and Hong Kong (6.1%).
PERFORMANCE OF SMEs EMPLOYMENT 2020
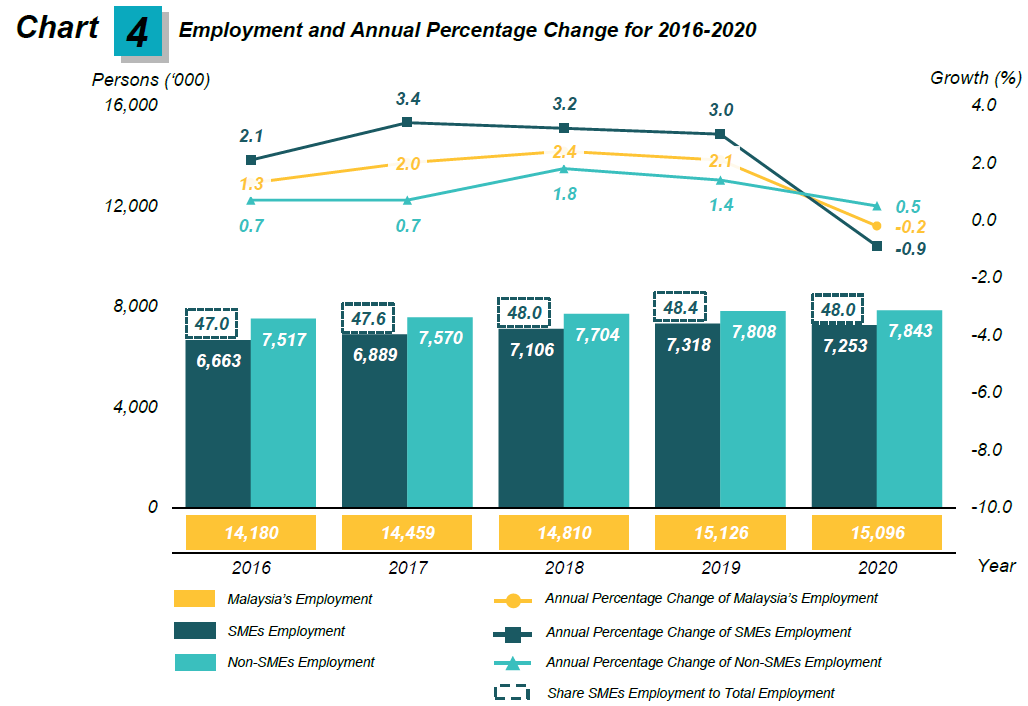
The share of SMEs employment dropped to 48.0 per cent in 2020 after persistently recorded an increase for the past few years. In terms of number, SMEs employment accounted for 7.25 million persons in 2020, decreased by 0.9 per cent or equivalent to 65 thousand persons as compared to 2019 (7.32 million persons). Larger decline in SMEs employment as against a decrease in Malaysia or national employment during the year indicating SMEs was hit significantly by the COVID-19 health crisis. Prior to 2020, the average annual change of SMEs employment was 3.0 per cent or with an addition of 200 thousand persons annually (Chart 4).
SMEs EMPLOYMENT BY KIND OF ECONOMIC ACTIVITY 2020
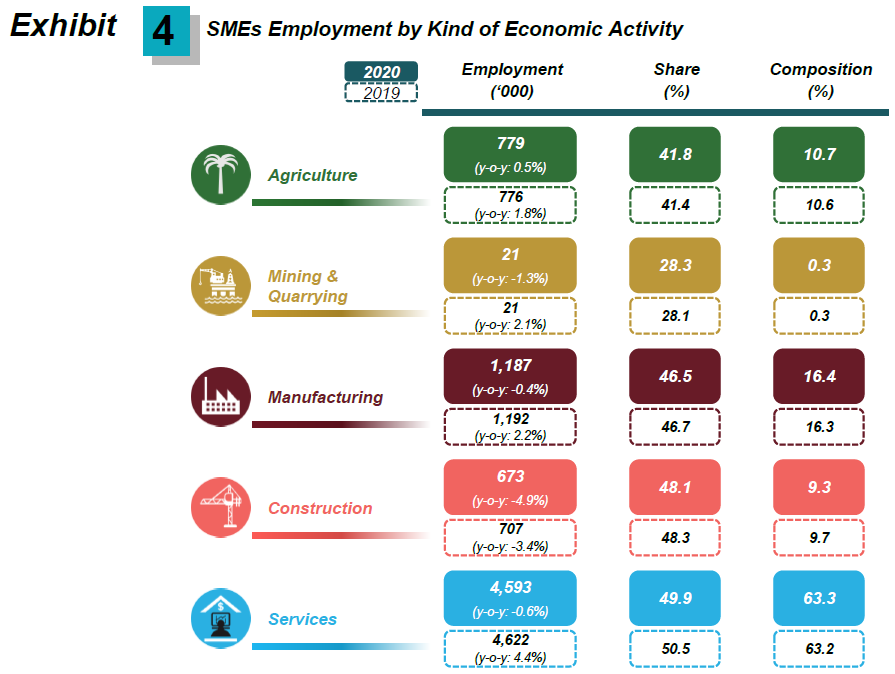
SMEs employment in the Agriculture sector contributed 41.8 per cent in 2020 (2019: 41.4%) from overall employment in this sector with 779 thousand persons. Agriculture was the only sector that posted a positive growth during the year, albeit at a slower rate of 0.5 per cent (2019: 1.8%).
Apart from the Agriculture sector which registered an increase in the contribution of SMEs employment, Mining & quarrying sector posted a marginal increase to 28.3 per cent (2019: 28.1%). However, number of SMEs employment in this sector decreased by 1.3 per cent (2019: 2.1%) to record 21 thousand employed persons in 2020.
Meanwhile, there were 1.19 million employed persons in SMEs Manufacturing sector which constituted 46.5 per cent of Manufacturing’s total employment (2019: 46.7%). The number of SMEs employment in this sector dropped marginally by 0.4 per cent in 2020 as against positive growth of 2.2 per cent in 2019. Although the number of SMEs employment in this sector dropped during the year, there were two sub-sectors posted an increase which were Petroleum, chemical, rubber and plastic products (1.5%) and Food, beverages and tobacco (1.0%) sub-sectors.
As for Construction sector, SMEs employment declined for a second year at negative 4.9 per cent after registering a drop of 3.4 per cent in 2019. SMEs employment in this sector accounted for 48.1 per cent (2019: 48.3%) with 673 thousand employed persons.
Meanwhile, number of SMEs employment for the Services sector was 4.59 million persons, contributing 49.9 per cent from overall employment in the sector. In terms of annual percentage change, SMEs employment in this sector plunged 0.6 per cent as compared to a positive growth of 4.4 per cent in 2019. All sub-sectors posted a decline in 2020 except for Finance, insurance, real estate and business services sub-sector which increased 0.5 per cent (2019: 3.0%).
The composition of SMEs employment by kind of economic activity is depicted in Exhibit 4. More than half of SMEs employment concentrated in Services sector with a share of 63.3 per cent and followed by the Manufacturing sector which accounted for 16.4 per cent in 2020. The SMEs employment in Agriculture sector constituted 10.7 per cent, increased slightly as compared to 10.6 per cent in the previous year. In addition, Construction and Mining & quarrying sectors recorded a percentage share below 10.0 per cent which were 9.7 per cent and 0.3 per cent respectively.
SMEs LABOUR PRODUCTIVITY 2020
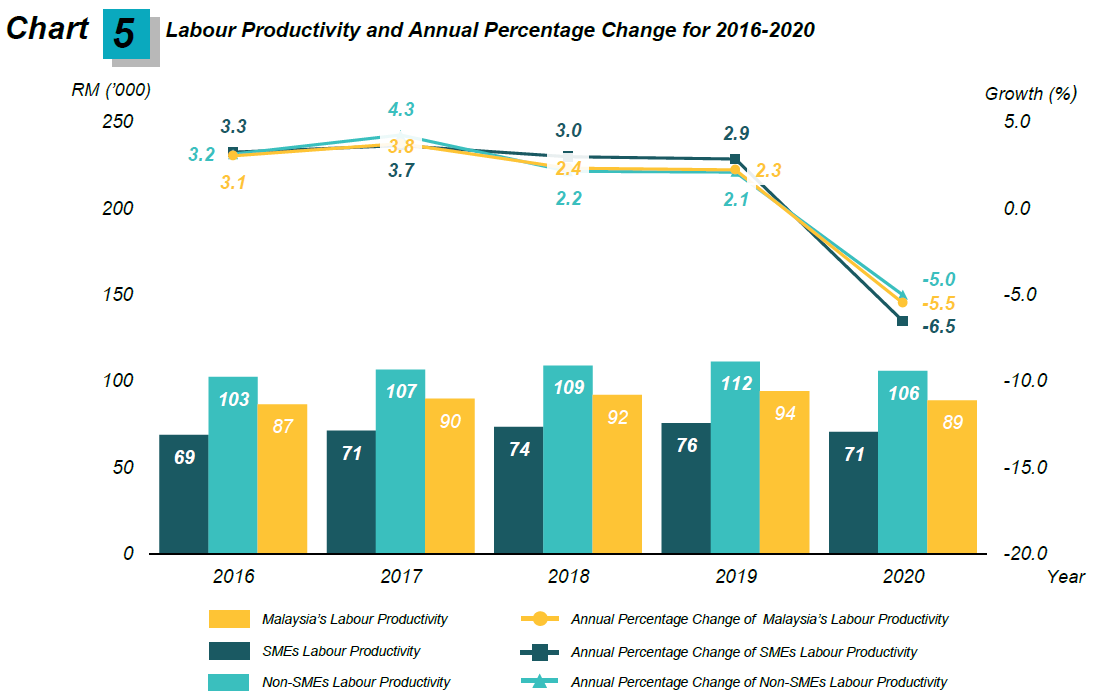
SMEs labour productivity for 2020 which measured as the ratio of value added per employment plunged by 6.5 per cent from a positive growth of 2.9 per cent in 2019 to record a productivity value of RM70,706 (2019: RM75,630) as illustrated in Chart 5. As a result of the decline in the economic performance during the year, SMEs GDP fell by 7.3 per cent (2019: 5.9%), declined at a faster rate than decreased in SMEs employment which was negative 0.9 per cent in 2020 (2019: 3.0%).
Year 2020 also saw a larger declined in SMEs labour productivity as compared to national and Non-SMEs productivity which dropped 5.5 per cent and 5.0 per cent respectively. In terms of productivity level, value added per employment for SMEs was always lower than national labour productivity (RM89,022) and Non SMEs labour productivity (RM105,959).
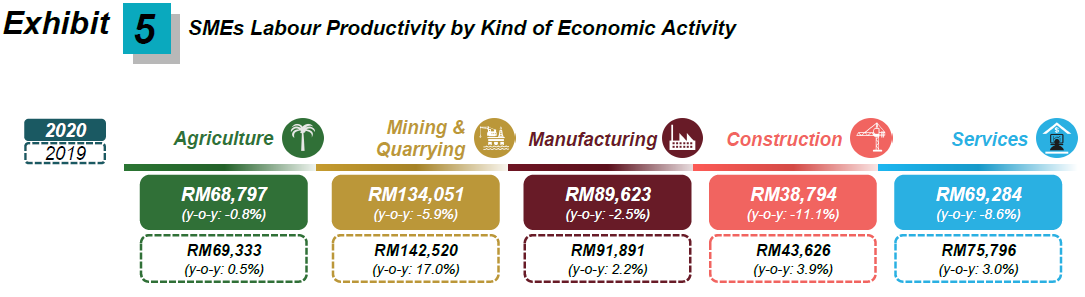
SMEs labour productivity by economic sector showed that all sectors were in a declining trend during 2020. The largest decline was recorded by Construction sector with a double digit negative growth of 11.1 per cent followed by Services (-8.6%) and Mining & quarrying (-5.9%). Meanwhile, SMEs labour productivity in Manufacturing dropped by 2.5 per cent while Agriculture declined 0.8 per cent (Exhibit 5).
The full publication of Small Medium Enterprises (SMEs) 2020 can be downloaded through eStatistik portal.
Released By:
DATO' SRI DR. MOHD UZIR MAHIDIN
CHIEF STATISTICIAN MALAYSIA
DEPARTMENT OF STATISTICS, MALAYSIA
![]() DrUzir_Mahidin
DrUzir_Mahidin ![]()
![]() Dr_Uzir
Dr_Uzir
28 July 2021
Contact person:
Mohd Yusrizal Ab Razak
Public Relation Officer
Strategic Communication and International Division
Department of Statistics, Malaysia
Tel : +603-8885 7942
Fax : +603-8888 9248
Email : yusrizal.razak[at]dosm.gov.my
Subscribe
Newsletter
Subscribe to our newsletter and stay updated
For interviews, press statement and clarification to the media, contact:
Baharudin Mohamad
Public Relation Officer
Email: baharudin[at]dosm.gov.my
Phone: 03 8090 4681
Not found what you looking for? Request data from us, through
Go to eStatistik
Email: data[at]dosm.gov.my
Phone: 03 8885 7128 (data request)


