
Services Producer Price Index
- Home
- Statistics
- Economy
- Prices
- Services Producer Price Index
Services Producer Price Index First Quarter Of 2017
Overview

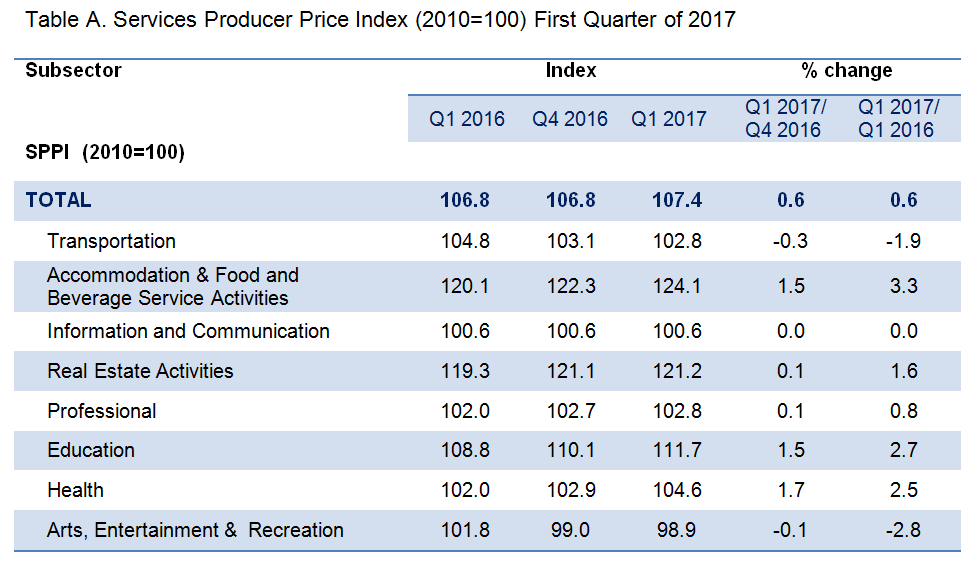
SERVICES PRODUCER PRICE INDEX (2010=100) FIRST QUARTER 2017
The Services Producer Price Index (SPPI) is designed to measure the average changes in the prices of services charged by the local services industry in Malaysia on a quarterly basis. This index is the first time issued by the Department of Statistics, Malaysia.
SPPI for the first quarter of 2017 registered an increase of 0.6 per cent compared to the previous quarter. The sub-sectors that recorded positive growth are Health (1.7%), Education (1.5%), Accommodation and Food & Beverage Service Activities (1.5%), Professional (0.1%) and Real Estate Activities (0.1%).
Year-on-year comparison for SPPI also showed an increase of 0.6 per cent. The following sub-sectors recorded positive growth i.e. Accommodation and Food & Beverage Service Activities (3.3%); Education (2.7%); Health (2.5%); Real Estate Activities (1.6%) and Professional (0.8%).
TRANSPORTATION
The SPPI for Transportation1 decreased by 0.3 per cent in the first quarter of 2017 compared to the fourth quarter of 2016. This was due to the decrease in the index of Passenger Air Transport (-0.5%) and Sea & Coastal Water Transport (-0.4%).
Year-on-year comparison showed the SPPI for Transportation also declined 1.9 per cent due to the decrease in the index of Passenger Air Transport (-5.6%) and Sea & Coastal Water Transport (-0.4%).
ACCOMMODATION & FOOD AND BEVERAGE SERVICE ACTIVITIES
The SPPI for Accommodation & Food and Beverage Service Activities2 for the first quarter of 2017 rose 1.5 per cent compared to the previous quarter. The increase was driven by the Restaurants and Mobile Food Service Activities (1.7%), Beverage Serving Activities (1.0%), Short-term Accommodation Activities (0.7%) and Event Catering and other Food Service Activities (0.5%).
The year-on-year comparison recorded an increase of 3.3 per cent contributed by Restaurants and Mobile Food Service Activities (4.0%), Beverage Serving Activities (2.5%), Event Catering and other Food Service Activities (1.5%) and Short-term Accommodation Activities (0.9%).
INFORMATION AND COMMUNICATION
Comparison for both quarter-on-quarter and year-on-year for the SPPI of Information & Communication3 showed that the index remained at 100.6.
REAL ESTATE ACTIVITIES
The SPPI for Real Estate Activities4 grew 0.1 per cent in the first quarter 2017 over the fourth quarter 2016. Similarly, the changes for year-on-year recorded an increase of 1.6 per cent.
PROFESSIONAL
In the first quarter of 2017, the SPPI for Professional5 recorded an increase of 0.1 per cent compared to the previous quarter. The increase was contributed by Accounting, Bookkeeping & Auditing Activities; Tax Consultancy (0.5%).
Year-on-year comparison also showed that the index rose 0.8 per cent, driven by Accounting, Bookkeeping & Auditing Activities; Tax Consultancy (0.9%), Architectural and Engineering Activities and Related Technical Consultancy (0.8%) and Legal Activities (0.5%).
EDUCATION
As compared to the previous quarter, the SPPI for Education6 increased 1.5 per cent in the first quarter of 2017. The increase was due to increases in the index of Secondary Education (2.3%), Pre-Primary and Primary Education (1.9%), Other Education (1.7%) and Higher Education (1.2%).
In the first quarter 2017, the SPPI for Education registered an increase of 2.7 per cent year-on-year. The growth was supported by Secondary Education (5.9%), Pre-Primary & Primary Education (2.4%), Higher Education (2.4%) and Other Education (1.7%).
HEALTH
In the first quarter of 2017, the SPPI for Health7 recorded an increase of 1.7 per cent compared to the previous quarter. The growth was propelled by the increases in the index of Hospital Activities (2.2%), Other Human Health Activities (1.8%) and Medical & Dental Practice Activities (1.0%).
Year-on-year comparison also shows that the index rose 2.5 per cent, driven by Other Human Health Activities (3.1%), Hospital Activities (3.0%) and the Medical & Dental Practice Activities (1.6%).
ARTS, ENTERTAINMENT AND RECREATION
The SPPI for Arts, Entertainment and Recreation8 dropped by 0.1 per cent in the first quarter 2017 as against the fourth quarter of 2016, caused by the decline in the index of Gambling and Betting Activities (-0.2%).
Year-on-year comparison shows a decrease of 2.8 per cent, due to the decrease in the index of Gambling and Betting Activities (-3.4%).
*Notes:
1 The industries covered are Freight Transport by Road; Transport of freight overseas and coastal waters, whether scheduled or not; Transport of passengers by air over regular routes and on regular schedules; Transport freight by air over regular routes and on regular schedules; Postal Activities; and Courier Activities other than National Post Activities.
2 The industries covered are Hotels and Resort Hotels; Restaurants and Restaurant cum Night Clubs; Cafeteria/Canteens; Fast-food Restaurants; Food Stalls/Hawkers; Event catering; Event/Food Caterers; Pubs, Bars, Discotheques, Coffee-houses, Cocktail Lounges and Karaoke; and Coffee Shops
3 The industries covered are Wired Telecommunication Services; Internet Access Providers by the Operator of the Wired Infrastructure; Wireless Telecommunication Services; Internet Access Providers by the Operator of the Wireless Infrastructure; Computer Consultancy; Data Processing Activities; and Web Portals
4 The industry covered is Activities of Real Estate Agents and Brokers for Buying, Selling and Renting of Real Estate
5 The industries covered are Legal Activities; Accounting, Bookkeeping and Auditing Activities; Tax Consultancy; and Engineering Services
6 The industries covered are Pre-primary Education (Private); Primary Education (Private); General School Secondary Education (Private); College and University Education (Private); Music and Dancing School; and Tuition Centre
7 The industries covered are Hospital Activities; General Medical Services; Specialized Medical Services; Dental Services; Dialysis Centres; and Medical Laboratories
8 The industries covered are Gambling and Betting Activities; Equestrian Clubs; Golf Courses; Bowling Centre; Fitness Centres; Activities of Amusement Parks and Theme Parks; and Cyber Café/Internet Centre
Released By:
THE OFFICE OF CHIEF STATISTICIAN MALAYSIA
DEPARTMENT OF STATISTICS, MALAYSIA
15 May 2017
Contact person:
Ho Mei Kei
Public Relation Officer
Corporate and User Services Division
Department of Statistics, Malaysia
Tel : +603-8885 7942
Fax : +603-8888 9248
Email : mkho[at]stats.gov.my
Subscribe
Newsletter
Subscribe to our newsletter and stay updated
For interviews, press statement and clarification to the media, contact:
Baharudin Mohamad
Public Relation Officer
Email: baharudin[at]dosm.gov.my
Phone: 03 8090 4681
Not found what you looking for? Request data from us, through
Go to eStatistik
Email: data[at]dosm.gov.my
Phone: 03 8885 7128 (data request)


