Overview
PRODUCER PRICE INDEX (2010=100) BY SECTOR (MSIC 2008)
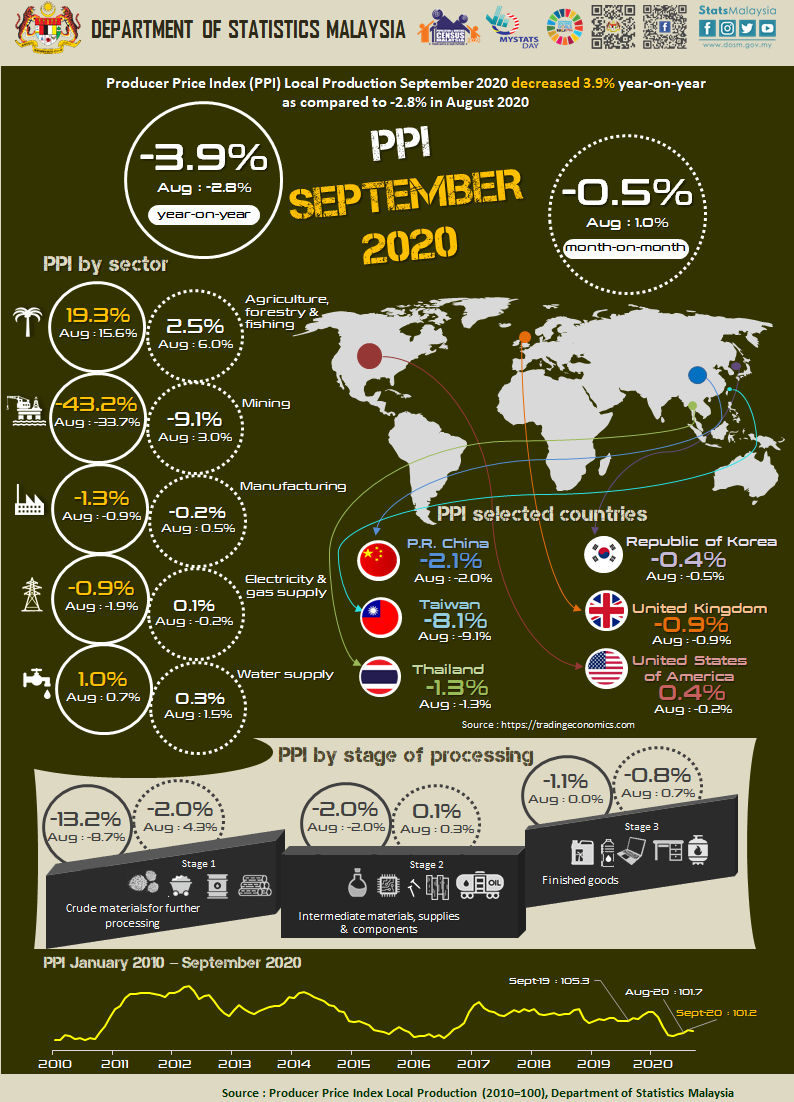
In September 2020, the Producer Price Index (PPI) local production fell 3.9 per cent year-on-year as compared to negative 2.8 per cent recorded in August 2020, declined for seven months since March 2020. The decreased in the overall index was attributed by the decline in Mining (-43.2%), Manufacturing (-1.3%) and Electricity & gas supply (-0.9%). Conversely, the index of Agriculture, forestry & fishing and Water supply rose 19.3 per cent and 1.0 per cent respectively.
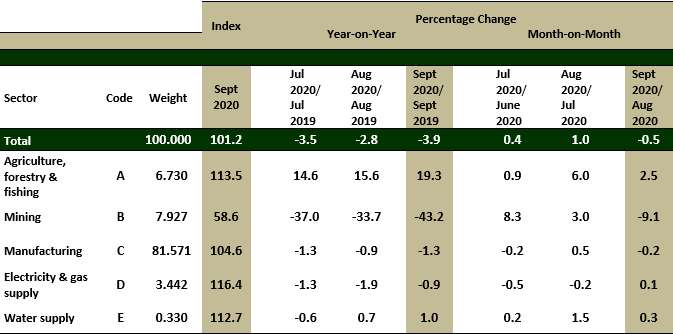
On a monthly basis, the PPI local production edged down by 0.5 per cent in September 2020 after recorded an increase of 1.0 per cent in August 2020. The decreased was mainly due to the decline in the index of Mining (-9.1%) and Manufacturing (-0.2%). However, the index of Agriculture, forestry & fishing, Water supply and Electricity & gas supply rose 2.5 per cent, 0.3 per cent and 0.1 per cent respectively. PPI local production for the period of January-September 2020 registered a decrease of 2.6 per cent as compared to 2.0 per cent decline in the same period of the previous year. [Table 1]
Table 1 : Producer Price Index (2010=100) Local Production by Sector (MSIC 2008), Malaysia
PPI LOCAL PRODUCTION FOR THIRD QUARTER 2020
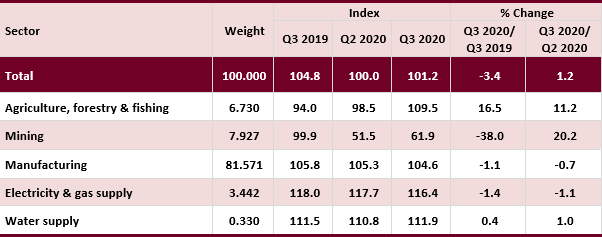
PPI local production for the third quarter 2020 declined 3.4 per cent to 101.2 as compared to 104.8 in the same quarter of the previous year. The decline was contributed by the index of Mining (-38.0%), Electricity & gas supply (-1.4%) and Manufacturing (-1.1%). Meanwhile, the index of Agriculture, forestry & fishing and Water supply recorded an increase of 16.5 per cent and 0.4 per cent. On a quarterly basis, the PPI local production increased 1.2 per cent as compared to negative 5.0 per cent in the second quarter 2020. [Table 2]
Table 2 : Average Index and Percentage Change of Quarterly PPI Local Production by Sector
PRODUCER PRICE INDEX BY STAGE OF PROCESSING
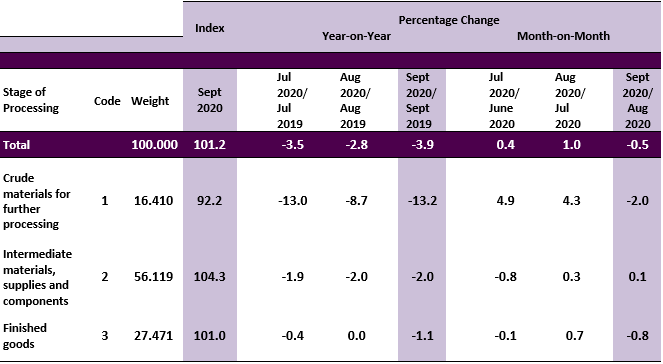
As compared to the same month a year ago, all stages of processing decreased. Crude materials for further processing slipped by 13.2 per cent followed by Intermediate materials, supplies & components (-2.0%) and Finished goods (-1.1%).
On a monthly comparison, negative changes in the indices were observed in two stages of processing, namely Crude materials for further processing (-2.0%) and Finished goods (-0.8%). Meanwhile, Intermediate materials, supplies & components index rose 0.1 per cent. [Table 3]
Table 3 : Producer Price Index (2010=100), Local Production by Stage of Processing
Released by:
DATO' SRI DR. MOHD UZIR MAHIDIN
CHIEF STATISTICIAN MALAYSIA
DEPARTMENT OF STATISTICS, MALAYSIA
 DrUzir_Mahidin
 Dr_Uzir
28th October 2020
Contact person:
Mohd Yusrizal Ab Razak
Public Relation Officer
Strategic Communication and International Division
Department of Statistics, Malaysia
Tel : +603-8885 7942
Fax : +603-8888 9248
E-mail : yusrizal.razak[at]dosm.gov.my


