
Malaysia External Trade Statistics
- Home
- Statistics
- Economy
- External Sector
- Malaysia External Trade Statistics
Malaysia External Trade Statistics March 2020
Malaysia External Trade Statistics February 2020 4 March 2020
Malaysia External Trade Statistics January 2020 4 February 2020
Malaysia External Trade December Statistics 2019 3 January 2020
Malaysia External Trade Statistics November 2019 4 December 2019
Malaysia External Trade Statistics October 2019 4 November 2019
Malaysia External Trade Statistics September 2019 Show all release archives
Overview
KEY FACTS
MONTHLY
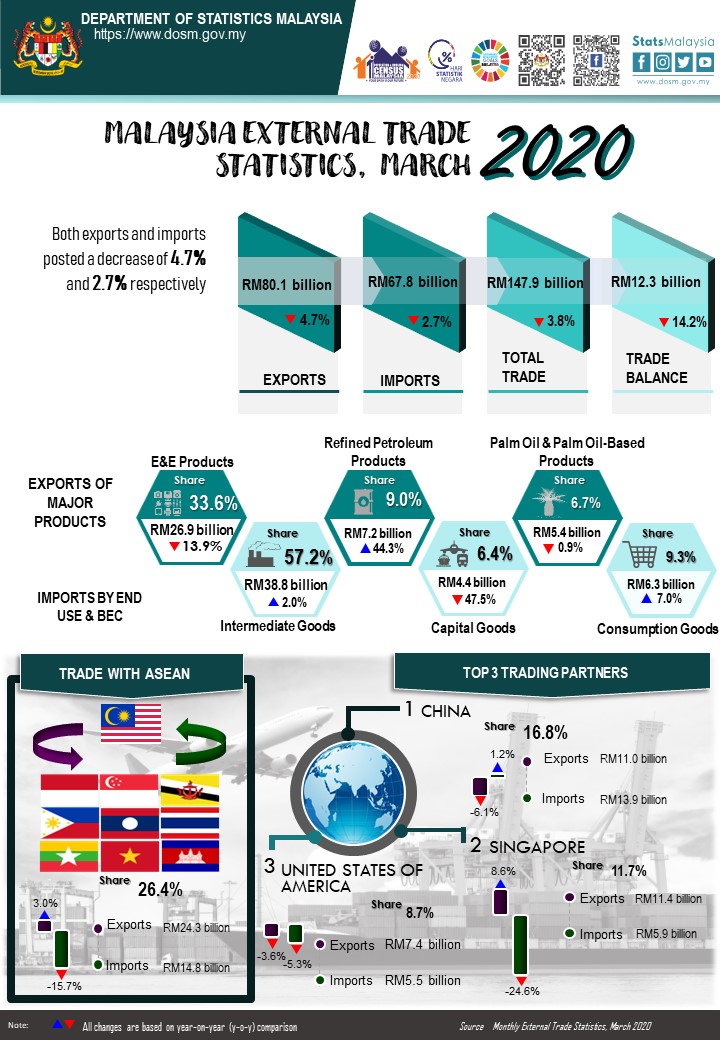
- Malaysia’s exports in March 2020, declined 4.7% to RM80.1 billion year-on-year (y-o-y). Re-exports was RM17.3 billion registering an increase of 13.4% y-o-y and accounted for 21.5% of total exports. However, domestic exports decreased 8.7% or RM6.0 billion to RM62.9 billion.
- Imports also decreased 2.7% y-o-y to RM67.8 billion.
- On a month-on-month (m-o-m) basis, exports grew 7.6% from RM74.5 billion. In seasonally adjusted terms, exports shrank 8.0%.
- On a m-o-m basis, imports expanded 9.6% or RM5.9 billion from RM61.8 billion. In seasonally adjusted terms, imports decreased 2.5%.
- On a y-o-y basis, exports fell due to the decrease in exports to Thailand (-RM2.0 billion), India (-RM1.4 billion), the European Union (-RM1.1 billion) and Viet Nam (-RM966.2 million). However, exports increased to Indonesia (+RM2.6 billion) and Singapore (+RM897.0 million).
- On a y-o-y basis, lower imports were mainly from Singapore (-RM 1.9 billion), the European Union (-RM1.5 billion) and Thailand (-RM1.2 billion). Meanwhile, higher imports were from Saudi Arabia (+RM1.1 billion), India (+RM612.0 million) and Indonesia (+RM553. 5 million).
QUARTERLY
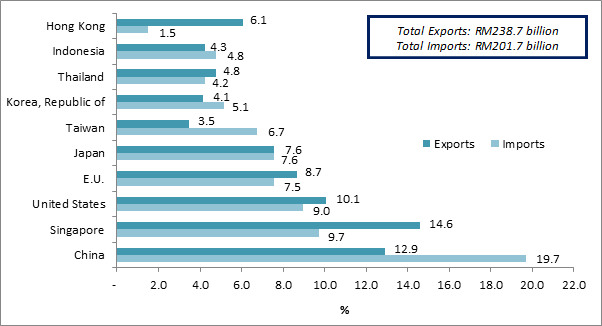
- In first quarter 2020, exports increased marginally 1.1% y-o-y to RM238.7 billion. Re-exports valued at RM43.3 billion also grew 0.5% y-o-y and accounted for 18.2% of total exports. Domestic exports rose 1.3% to RM195.3 billion from a year ago.
- Imports also registered an increase of 1.3% y-o-y to RM201.7 billion.
- On a quarter-on-quarter (q-o-q) basis, exports declined 7.4% from RM257.8 billion.
- On a q-o-q basis, imports also slowed down by 8.9% from RM221.4 billion.
- On a y-o-y basis, the growth in exports was attributed to higher exports to Indonesia (+RM3.2 billion), Singapore (+RM3.1 billion), the United States (+RM2.1 billion) and Republic of Korea (+RM1.6 billion). However, exports decreased to Thailand (-RM3.6 billion), the European Union (-RM2.2 billion), Hong Kong (-RM1.6 billion) and India (-RM1.5 billion).
- On a y-o-y basis, higher imports were mainly from the United State (+RM2.0 billion), Republic of Korea (+RM1.6 billion), India (+RM1.5 billion), Saudi Arabia (+RM1.4 billion) and Indonesia (+RM904.4 million). Meanwhile, lower imports were from Thailand (-RM2.8 billion), the European Union (-RM2.2 billion) and Singapore (-RM1.8 billion).
TRADE
Total trade valued at RM147.9 billion decreased RM5.8 billion or 3.8% compared to March 2019. However, it posted an increase of RM11.6 billion or 8.5% as compared to February 2020. The trade surplus was RM12.3 billion, declined RM2.0 billion (-14.2%) from a year ago. It also decreased at 2.2% or RM280.6 million as compared to the previous month.
EXPORTS
On a y-o-y basis, exports decreased 4.7% to RM80.1 billion. The main products which attributed to the decline were:
- Electrical and electronic (E&E) products (33.6% of total exports), shrank RM4.4 billion (-13.9%) to RM26.9 billion;
- Liquefied natural gas (LNG), which accounted for 4.2% of total exports declined RM518.0 million or 13.4% to RM3.4 billion due to the decrease in both average unit value (-12.1%) and export volume (-1.5%);
- Timber and timber-based products, which contributed 2.0% to total exports, decreased RM293.0 million or 15.6% to RM1.6 billion;
- Crude petroleum (2.9% of total exports) contracted RM101.6 million or 4.2% to RM2.3 billion due to the shrink in average unit value (-6.1%) despite the export volume increased 2.0%;
- Palm oil and palm oil-based products (6.7% of total exports), registered a marginal decrease of RM48.8 million (-0.9%) to RM5.4 billion. Exports of palm oil, the major commodity in this group of products declined RM43.5 million or 1.4% due to the decline in export volume (-22.0%) despite the average unit value increased 26.4%; and
- Natural rubber which accounted for 0.3% of total exports, decreased RM29.6 million or 9.7% to RM276.3 million due to the lower in export volume(-15.1%) despite the average unit value rose 6.5%.
However, exports of refined petroleum products recorded an increase of RM2.2 billion or 44.3% to RM7.2 billion due to the growth in export volume (+60.4%) even though the average unit value decreased 10.0%.
On a m-o-m basis, exports rose RM5.7 billion (+7.6%) from RM74.5 billion. The main products which contributed to the growth were:
- Refined petroleum products, which expanded RM2.8 billion or 62.6% from RM4.4 billion due to the growth in both export volume (+62.5%) and average unit value (+0.02%);
- E&E products increased RM1.8 billion (+7.1%) from RM25.1 billion; and
- Crude petroleum rose RM620.9 million or 36.9% from RM1.7 billion due to the increase in export volume (+52.9%) although the average unit value decreased 10.5%.
However, declines were recorded for the following products:
- Timber and timber-based products decreased RM363.4 million (-18.6%) from RM2.0 billion;
- Palm oil and palm oil-based products declined RM39.2 million or 0.7% from RM5.4 billion. Exports of palm oil decreased RM106.9 million or 3.4% due to the drop in both export volume (-1.9%) and average unit value (-1.6%);
- Natural rubber dropped RM34.2 million or 11.0% from RM310.5 million due to the decline in export volume (-12.8%) despite the average unit value increased 2.1%; and
- LNG, recorded a marginal decrease of RM14.9 million (-0.4%) from RM3.4 billion due to the decrease in average unit value (-1.9%) even though export volume increased 1.4%.
Exports to Country of Destination
Two major destinations for Malaysia’s exports in March 2020 were Singapore and China.
Exports to Singapore amounted RM11.4 billion, increased RM897.0 million or 8.6% as compared to the previous year. The main product which attributed to the increment was refined petroleum products, which contributed 22.0% of total exports rose RM1.5 billion (+155.7%) to RM2.5 billion. However, exports of E&E products declined RM249.6 million or 5.4% to RM4.4 billion.
Exports to China which was valued at RM11.0 billion declined RM713.0 million (-6.1%). The main products that attributed to the decrease was E&E products, which contributed 32.5% of total exports fell RM1.3 billion (-27.4%) to RM3.6 billion. However, exports of refined petroleum products increased RM451.3 million to RM519.1 million.
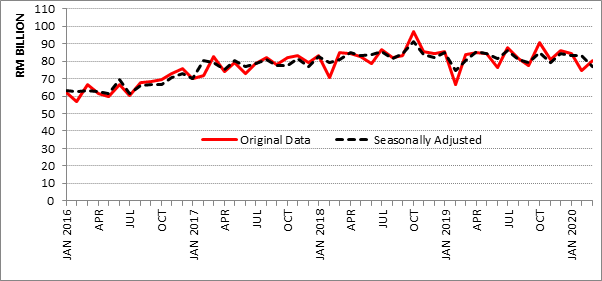
Seasonally Adjusted Export Value
On a m-o-m basis seasonally adjusted terms, exports fell RM6.7 billion (-8.0%) to RM76.7 billion.
Exports, 2016-2020
IMPORTS
On a y-o-y basis, imports declined RM1.9 billion or 2.7% to RM67.8 billion.
- Capital Goods
In March 2020, total imports of capital goods which accounted for 6.4% of total imports declined by 47.5% to RM4.4 billion. Capital goods (except transport equipment) were down by RM792.6 million (-10.8%) to RM6.6 billion. Retained imports of transport equipment, industrial was –RM2.2 billion due to re-exports of this good exceeded imports.
- Intermediate Goods
These goods which constituted 57.2% of total imports expanded RM763.0 million (+2.0%) to RM38.8 billion. The increase was mainly attributed to fuel & lubricants, primary (+RM1.4 billion, +40.7%) and industrial supplies, primary (+RM731.8 million, +36.4%). However, decreases were recorded for part & accessories of capital goods (except transport equipment) (-RM810.9 million, -6.7%) and parts & accessories of transport equipment (-RM615.5 million, -24.4%).
- Consumption Goods
Imports of consumption goods which constituted 9.3% of total imports recorded an increase of RM410.9 million (+7.0%) to RM6.3 billion. The growth was mainly attributed to food & beverages, processed, mainly of household consumption (+RM320.3 million, +18.6%) and food & beverages, primary, mainly for household consumption (+RM247.1 million, +29.2%).
On a m-o-m basis, imports increased RM5.9 billion or 9.6% from RM61.8 billion. The increase in imports by end use was attributed to increases in consumption goods and intermediate goods as follows:
- Consumption Goods
Imports of these goods registered an increase of RM1.3 billion (+25.7%) from RM5.0 billion. The increase was due to food & beverages, processed, mainly for household consumption (+RM437.7 million, +27.3%), semi-durables (+RM364.9 million, +55.2%) and food & beverages, primary, mainly for household consumption (+RM277.4 million, +34.0%).
- Intermediate Goods
These goods rose RM391.3 million (+1.0%) from RM38.4 billion. The main components contributed to the growth were fuel & lubricants, primary (+RM2.1 billion, +81.3%) and industrial supplies, processed (+RM1.3 billion, +9.8%). However, decreases were recorded for part & accessories of capital goods (except for transport equipment) (-RM2.4 billion, -17.3%) and fuel & lubricants, processed, other (-RM1.2 billion, -42.2%).
- Capital Goods
Imports of capital goods declined by 20.6% to RM4.4 billion compared to RM5.5 billion recorded in the previous month on account of transport equipment, industrial which was valued at -RM2.2 billion. On the other hand, capital goods (except transport equipment) increased by RM1.4 billion (+26.8%) to RM6.6 billion.
Imports by Country of Origin
Two main sources of Malaysia’s import in March 2020 were China and Singapore.
Imports from China which registered RM13.9 billion rose RM160.1 million (+1.2%) when compared to March 2019. The main products which attributed to the increase was E&E, which contributed 40.5% of total imports expanded RM582.7 million or 11.5% to RM5.6 billion.
Imports from Singapore which was valued at RM5.9 billion, declined RM1.9 billion or 24.6% from a year ago. The main products which attributed to the drop were:
- Refined petroleum products (33.8% of total imports), shrank RM659.5 million or 24.8% to RM2.0 billion; and
- E&E products, which contributed 32.5% of total imports fell RM629.4 million (-24.7%) to RM1.9 billion.
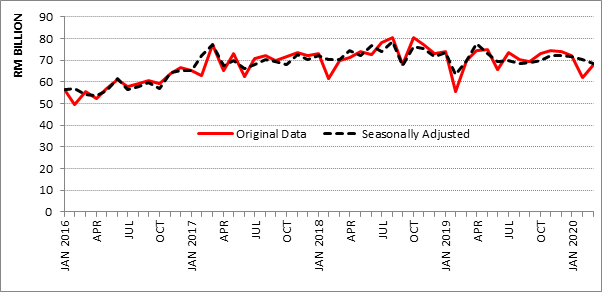
Seasonally Adjusted Import Value
On a m-o-m basis seasonally adjusted terms, imports decreased RM1.7 billion (-2.5%) to RM68.4 billion.
Imports, 2016-2020
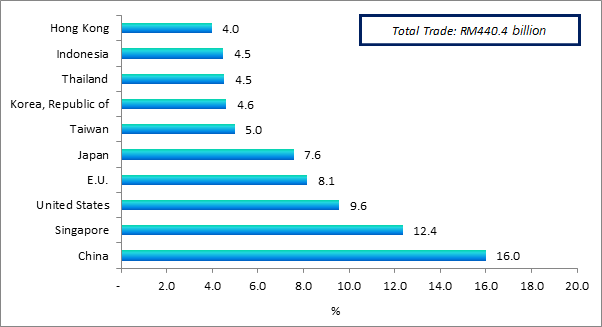
MARKET SHARE
The following charts show Malaysia's major trading partners for January - March 2020.
Total Trade by Major Countries, Jan-Mar 2020, percentage share
Exports and Imports by Major Countries, Jan-Mar 2020, percentage share
The following charts show Malaysia’s trade with ASEAN countries for January-March 2020.
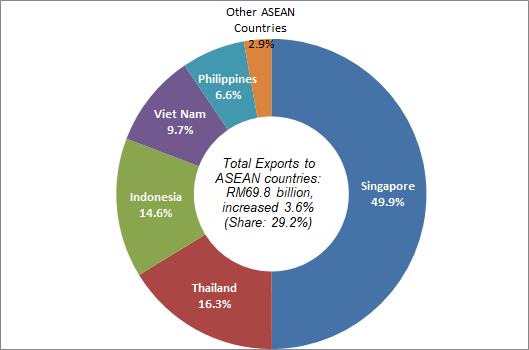
Exports, Jan-Mar 2020, percentage share
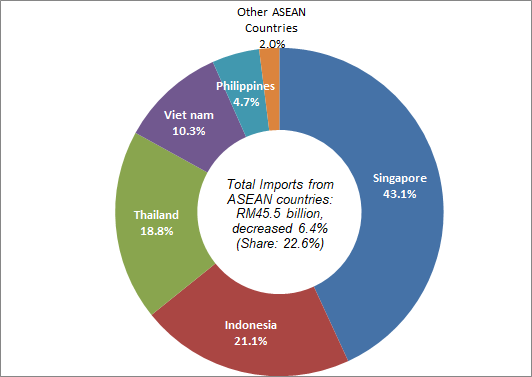
Imports, Jan-Mar 2020, percentage share
#Notes:
1. The March 2020 data is provisional and subject to revision in later issues.
2. This report can be accessed through the web portal of the Department of Statistics, Malaysia (https://www.dosm.gov.my) under section: Latest Release.
Released By:
DATO' SRI DR. MOHD UZIR MAHIDIN
CHIEF STATISTICIAN MALAYSIA
DEPARTMENT OF STATISTICS, MALAYSIA
![]() DrUzir_Mahidin
DrUzir_Mahidin ![]()
![]() Dr_Uzir
Dr_Uzir
4 MAY 2020
Contact person:
Mohd Yusrizal Ab Razak
Public Relation Officer
Strategic Communication and International Division
Department of Statistics, Malaysia
Tel : +603-8885 7942
Fax : +603-8888 9248
E-mail : yusrizal.razak[at]dosm.gov.my
Subscribe
Newsletter
Subscribe to our newsletter and stay updated
For interviews, press statement and clarification to the media, contact:
Baharudin Mohamad
Public Relation Officer
Email: baharudin[at]dosm.gov.my
Phone: 03 8090 4681
Not found what you looking for? Request data from us, through
Go to eStatistik
Email: data[at]dosm.gov.my
Phone: 03 8885 7128 (data request)


