Overview

SUMMARY OF FINDINGS
Consumer Price Index (CPI) increased 1.1 per cent in October 2019 to 122.0 as against 120.7 in the same month of the preceding year. The increase in the overall index was driven by the index of Alcoholic Beverages & Tobacco (2.2%), Miscellaneous Goods & Services (2.2%), Education (1.9%) and Food & Non-Alcoholic Beverages (1.8%). (Chart 1)
On a monthly basis, CPI increased 0.2 per cent at 122.0 as compared to September 2019. The increase was contributed by Communication (1.6%), Transport (0.2%), Food & Non-Alcoholic Beverages (0.1%), Health (0.1%) and Education (0.1%).
Meanwhile, the CPI for the period January to October 2019 increased 0.6 per cent as compared to the same period last year.
Chart 1: Consumer Price Index (2010=100): Percentage Change by Main Group, Malaysia, October 2019/October 2018

Index for Sub-Groups Food and Non-Alcoholic Beverages
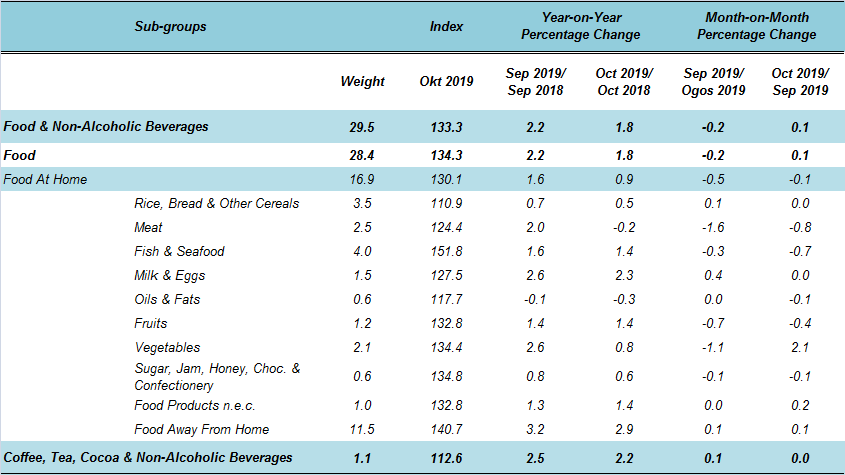
The index for Food & Non-Alcoholic Beverages increased 1.8 per cent in October 2019 as compared to the same month of the previous year. The increase was attributed by the food sub-group Milk & Eggs (2.3%), Fish & Seafood (1.4%), Fruits (1.4%) and Food Products not elsewhere classified (1.4%).
The index for Food Away From Home increased 2.9 per cent in October 2019 as against October 2018. The rise in the price of Fried Chicken, Burger and Sea Food Other Than Fish contributed to the increase of the index of this sub-group. (Table 1)
Table 1: Consumer Price Index (2010=100): Annual Percentage Change by
Food & Non-Alcoholic Beverages Sub-Groups, Malaysia, October 2019/October 2018
Consumer Price Index by States
Three states namely Wilayah Persekutuan Kuala Lumpur (1.3%), Pulau Pinang (1.3%) and Selangor & Wilayah Persekutuan Putrajaya (1.2%) surpassed the national CPI rate of 1.1 per cent in October 2019 as compared to the same month in the preceding year.
All states registered an increase in the index of Food & Non-Alcoholic Beverages. The highest increases were recorded by Johor (2.5%), followed by Wilayah Persekutuan Kuala Lumpur (2.4%), Pulau Pinang (2.1%) and Selangor & Wilayah Persekutuan Putrajaya (2.0%). The increase surpassed the national index of Food & Non-Alcoholic Beverages in October 2019. (Chart 2)
Chart 2: Consumer Price Index (2010=100): Annual Percentage Change for Food & Non-Alcoholic Beverages by State,
October 2019/October 2018

Core Index
Core index rose 1.4 per cent in October 2019 as compared to the same month of the previous year. Among the major groups, which influenced the higher core rate were Miscellaneous Goods & Services (2.2%), Food & Non-Alcoholic Beverages (2.1%) and Housing, Water, Electricity, Gas & Other Fuels (2.0%).
Core index excludes most volatile items of fresh food as well as administered prices of goods and services. (Table 2)
Table 2: Consumer Price Index (2010=100): Percentage Change of Headline CPI, Seasonally Adjusted Index and
Core Index by Main Groups, Malaysia, October 2019/October 2018

Annex 1: Average Price for Selected Items in Malaysia, October 2019 (RM)
Released By:
DATO' SRI DR. MOHD UZIR MAHIDIN
CHIEF STATISTICIAN MALAYSIA
DEPARTMENT OF STATISTICS, MALAYSIA
 DrUzir_Mahidin
 Dr_Uzir
20 November 2019
Contact person:
Rohaida binti Mohamad
Public Relation Officer
Strategic Communication and International Division
Department of Statistics, Malaysia
Tel : +603-8885 7942
Fax : +603-8888 9248
Email : rohaida.mohamad[at]dosm.gov.my


