
Consumer Price Index
- Home
- Statistics
- Economy
- Prices
- Consumer Price Index
Consumer Price Index Malaysia June 2015
Consumer Price Index Malaysia May 2015 22 May 2015
Consumer Price Index Malaysia April 2015 22 April 2015
Consumer Price Index Malaysia March 2015 20 March 2015
Consumer Price Index Malaysia February 2015 18 February 2015
Consumer Price Index Malaysia January 2015 21 January 2015
Consumer Price Index Malaysia December 2014 Show all release archives
Overview
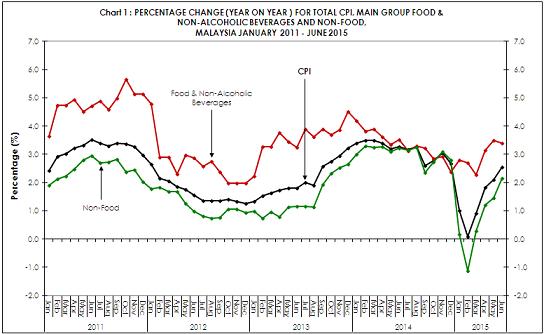
Overall, the index for Food & Non-Alcoholic Beverages (weight: 30.3) rose 3.4 per cent on a year-on-year basis in June 2015. Meanwhile, the index for Non-Food (weight: 69.7) recorded a slower increase of 2.1 per cent (Chart 1 and Table 1).
CPI for June 2015 increased 0.6 per cent on a month-on-month basis. CPI for the first six months in 2015 also registered an increase by 1.4 per cent as compared to the same period last year.
Monthly Changes for CPI
CPI for June 2015 increased by 0.6 per cent as compared to May 2015. Of the twelve major groups, nine recorded an increase, one registered a decline while two remained unchanged. Among the major groups which recorded increases in June 2015 were Transport (+3.0 per cent); Furnishings, Household Equipment & Routine Household Maintenance (+0.5 per cent); Food & Non-Alcoholic Beverages (+0.4 per cent); Health (+0.4 per cent); Education (+0.2 per cent); Restaurants & Hotels (+0.2 per cent); and Miscellaneous Goods & Services (+0.2 per cent). On the other hand, a decrease was recorded in the index of Clothing & Footwear by 0.3 per cent.
Based on a seasonally adjusted term, the CPI for June 2015 increased by 0.6 per cent as compared to May 2015 (Table 1).
|
Group
|
Wt.
|
Index
|
Year-on-Year Percentage Change |
Month-on-Month Percentage Change
|
Seasonally Adjusted Index | ||||
|
June 2015
|
May 2015/ May 2014
|
June 2015/ June 2014
|
Jan - June 2015/2014
|
May 2015/
April 2015 |
June 2015/
May 2015 |
June 2015 | % Change June 2015/May 2015 | ||
| TOTAL |
100.0
|
113.0 | 2.1 | 2.5 | 1.4 | 0.4 | 0.6 | 113.0 | 0.6 |
| Food & Non-Alcoholic Beverages |
30.3
|
119.0 | 3.5 | 3.4 | 3.0 | 0.4 | 0.4 | 118.9 | 0.2 |
| Alcoholic Beverages & Tobacco |
2.2
|
135.6 | 11.3 | 11.3 | 11.3 | -1.5 | 0.1 | 135.6 | 0.1 |
| Clothing & Footwear |
3.4
|
99.2 | 0.9 | 0.7 | 0.2 | 0.1 | -0.3 | 99.2 | -0.3 |
| Housing, Water, Electricity, Gas & Other Fuels |
22.6
|
111.4 | 2.6 | 2.5 | 2.3 | 0.7 | 0.0 | 111.4 | 0.1 |
| Furnishings, Household Equip. & Routine Household Maintenance |
4.1
|
110.0 | 2.6 | 3.2 | 1.5 | 0.4 | 0.5 | 110.0 | 0.5 |
| Health |
1.3
|
115.4 | 5.0 | 5.0 | 4.2 | 0.3 | 0.4 | 115.4 | 0.4 |
| Transport |
14.9
|
109.5 | -4.7 | -1.4 | -5.6 | 0.2 | 3.0 | 109.5 | 3.0 |
| Communication |
5.7
|
100.3 | 2.6 | 2.6 | 0.7 | 0.1 | 0.0 | 100.3 | 0.0 |
| Recreation Services & Culture |
4.6
|
106.8 | 1.6 | 1.7 | 1.1 | 0.2 | 0.1 | 106.8 | 0.1 |
| Education |
1.4
|
112.5 | 2.5 | 2.6 | 2.4 | -0.1 | 0.2 | 112.4 | 0.3 |
| Restaurants & Hotels |
3.2
|
122.2 | 4.5 | 4.5 | 3.8 | 0.4 | 0.2 | 122.2 | 0.2 |
| Miscellaneous Goods & Services |
6.3
|
110.2 | 4.4 | 4.6 | 2.9 | 0.3 | 0.2 | 110.2 | 0.2 |
| Non-Food |
69.7
|
110.4 | 1.4 | 2.1 | 0.6 | 0.3 | 0.7 | 110.4 | 0.7 |
| Durable Goods |
6.5
|
97.4 | -0.2 | 1.0 | -0.6 | 0.1 | 0.1 | 97.4 | 0.1 |
| Semi-Durable Goods |
4.4
|
100.1 | 1.0 | 0.7 | 0.3 | 0.0 | -0.3 | 100.1 | -0.3 |
| Non-Durable Goods |
41.6
|
114.9 | 0.7 | 1.6 | -0.1 | 0.2 | 1.2 | 114.9 | 1.2 |
| Services |
47.5
|
114.7 | 3.7 | 3.8 | 3.3 | 0.6 | 0.2 | 114.7 | 0.2 |
|
Sub-Groups
|
Wt.
|
Index | Year-on-Year Percentage Change | Month-on-Month Percentage Change | |||
|
June 2015
|
May 2015/ May 2014
|
June 2015/ June 2014
|
Jan - June 2015/2014
|
May 2015/ April 2015
|
June 2015/ May 2015
|
||
| Food & Non-Alcoholic Beverages | 30.3 | 115.1 | 3.5 | 3.4 | 3.0 | 0.4 | 0.4 |
| Food | 28.9 | 115.4 | 3.6 | 3.5 | 3.0 | 0.5 | 0.4 |
| Food At Home | 18.9 | 114.8 | 3.4 | 3.2 | 2.7 | 0.4 | 0.5 |
| Rice, Bread & Other Cereals | 4.4 | 105.5 | 1.9 | 1.8 | 1.4 | 0.1 | 0.0 |
| Meat | 2.9 | 116.4 | 3.4 | 3.0 | 1.6 | 0.3 | 0.7 |
|
Fish & Seafood
|
4.5 | 124.0 | 3.5 | 3.2 | 2.9 | 0.7 | 1.1 |
| Milk & Eggs | 1.8 | 116.7 | 5.9 | 4.6 | 6.0 | -0.2 | -0.6 |
| Oils & Fats | 0.6 | 101.0 | 0.7 | 0.7 | 0.4 | 0.0 | -0.1 |
| Fruits | 1.2 | 115.6 | 2.7 | 3.0 | 2.4 | 0.3 | 0.3 |
| Vegetables | 2.1 | 110.8 | 5.3 | 5.4 | 4.2 | 1.6 | 1.5 |
| Sugar, Jam, Honey, Chocolate & Confectionary | 0.6 | 129.2 | 2.1 | 2.1 | 1.5 | 0.2 | 0.1 |
| Foof Products n.e.c | 0.8 | 114.0 | 4.7 | 4.8 | 3.6 | 0.3 | 0.3 |
| Food Away From Home | 10.0 | 116.5 | 3.7 | 3.8 | 3.6 | 0.5 | 0.2 |
| Coffee, Tea, Cocoa & Non-Alcoholic Beverages | 1.4 | 107.7 | 3.5 | 3.2 | 1.9 | 0.5 | -0.2 |
The CPI according to physical longevity of goods and services showed increases in the index of Non-Durable Goods (+1.2 per cent); Services (+0.2 per cent) and Durable Goods (+0.1 per cent) while Semi-Durable Goods decreased by 0.3 per cent.
CPI changes for the period January – June 2015 / 2014
The increase of 1.4 per cent in the CPI for the first six months in 2015 was led by increases among the main groups with high weights: Food & Non-Alcoholic Beverages (+3.0 per cent) and Housing, Water, Electricity, Gas & Other Fuels (+2.3 per cent). Other increases were Alcoholic Beverages & Tobacco (+11.3 per cent); Health (+4.2 per cent); Restaurants & Hotels (+3.8 per cent); and Miscellaneous Goods & Services (+2.9 per cent). On the other hand, a decrease was recorded in the index of Transport by 5.6 per cent.
Based on the above changes and the weights assigned to the main groups, the relative contribution to the overall increase of 1.4 per cent in the CPI is shown in Table 3.
Table 3 : CONTRIBUTION TO THE CHANGES IN THE OVERALL CONSUMER PRICE INDEX BY MAIN GROUPS, MALAYSIA (2010=100)
|
Group
|
Wt.
|
2014 / 2013
|
June 2015 / 2014 |
January - June 2015 / 2014
|
|||
| % Change | % Contribution | % Change | % Contribution | % Change | % Contribution | ||
| TOTAL | 100.0 | 3.2 | 100.0 | 2.5 | 100.0 | 1.4 | 100.0 |
| Food & Non-Alcoholic Beverages | 30.3 | 3.3 | 34.0 | 3.4 | 41.7 | 3.0 | 65.5 |
|
Alcoholic Beverages & Tobacco
|
2.2 | 11.6 | 8.3 | 11.3 | 10.5 | 11.3 | 18.8 |
| Clothing & Footwear | 3.4 | -0.2 | -0.3 | 0.7 | 0.7 | 0.2 | 0.3 |
| Housing, Water, Electricity, Gas & Other Fuels | 22.6 | 3.4 | 24.1 | 2.5 | 21.8 | 2.3 | 36.1 |
| Furnishings, Household Equipment & Routine Household Maintenance | 4.1 | 1.0 | 1.3 | 3.2 | 4.9 | 1.5 | 4.0 |
| Health | 1.3 | 2.9 | 1.2 | 5.0 | 2.6 | 4.2 | 3.9 |
| Transport | 14.9 | 4.9 | 23.1 | -1.4 | -8.0 | -5.6 | -58.1 |
| Communication | 5.7 | -0.7 | -1.3 | 2.6 | 5.0 | 0.7 | 2.6 |
| Recreation Services & Culture | 4.6 | 1.5 | 2.2 | 1.7 | 2.8 | 1.1 | 3.3 |
|
Education
|
1.4 | 2.4 | 1.1 | 2.6 | 1.4 | 2.4 | 2.3 |
| Restaurant & Hotel | 3.2 | 4.7 | 5.0 | 4.5 | 6.0 | 3.8 | 8.8 |
| Miscellaneous Goods & Services | 6.3 | 0.7 | 1.3 | 4.6 | 10.6 | 2.9 | 12.5 |
The increase of 3.0 per cent in the index for Food & Non-Alcoholic Beverages was the result of increases for Food At Home (+2.7 per cent); Food Away From Home (+3.6 per cent) and Coffee, Tea, Cocoa & Non-Alcoholic Beverages (+1.9 per cent). Among the subgroups of Food At Home which showed significant increases during this period as shown in Table 2 were Milk & Eggs (+6.0 per cent); Vegetables (+4.2 per cent); Fish & Seafood (+2.9 per cent); and Fruits (+2.4 per cent).
Released By:
THE OFFICE OF CHIEF STATISTICIAN MALAYSIA
DEPARTMENT OF STATISTICS, MALAYSIA
15 July 2015
Contact person:
Norrita binti Amran
Public Relation Officer
Corporate and User Services Division
Department of Statistics, Malaysia
Tel : +603-8885 7942
Fax : +603-8888 9248
Email : norrita.amran@stats.gov.my
Subscribe
Newsletter
Subscribe to our newsletter and stay updated
For interviews, press statement and clarification to the media, contact:
Baharudin Mohamad
Public Relation Officer
Email: baharudin[at]dosm.gov.my
Phone: 03 8090 4681
Not found what you looking for? Request data from us, through
Go to eStatistik
Email: data[at]dosm.gov.my
Phone: 03 8885 7128 (data request)


