
Consumer Price Index
- Home
- Statistics
- Economy
- Prices
- Consumer Price Index
Consumer Price Index Malaysia December 2020
Consumer Price Index Malaysia November 2020 25 November 2020
Consumer Price Index Malaysia October 2020 21 October 2020
Consumer Price Index Malaysia September 2020 23 September 2020
Consumer Price Index Malaysia August 2020 18 August 2020
Consumer Price Index Malaysia July 2020 22 July 2020
Consumer Price Index Malaysia June 2020 Show all release archives
Overview
Summary Findings
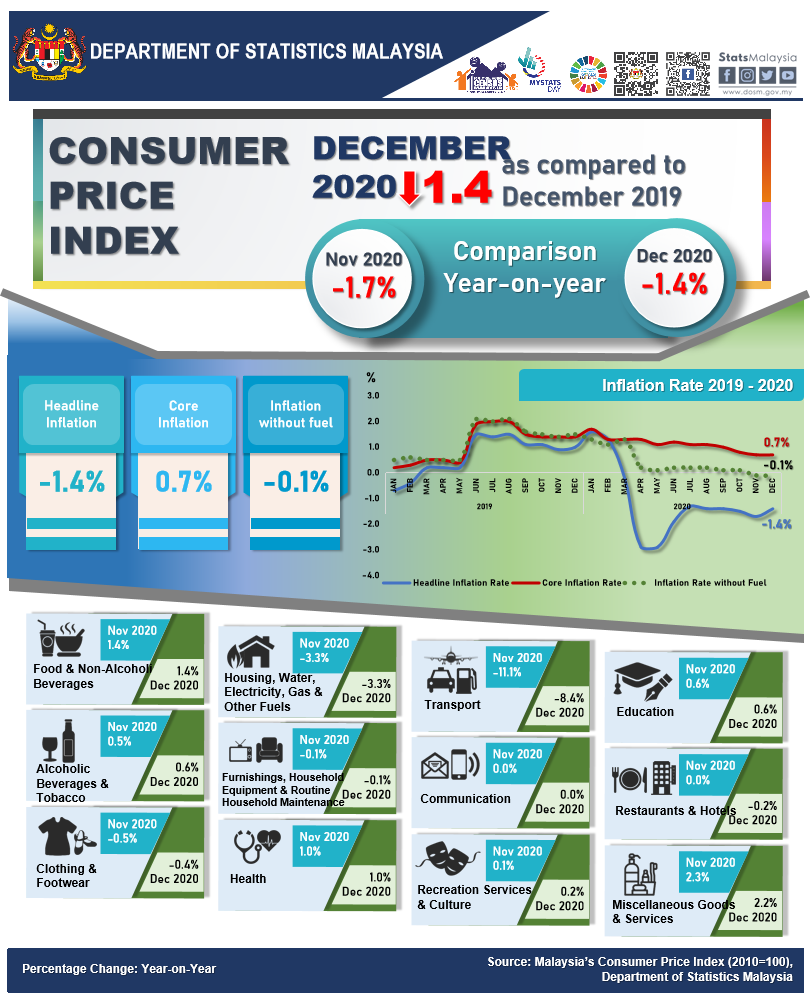
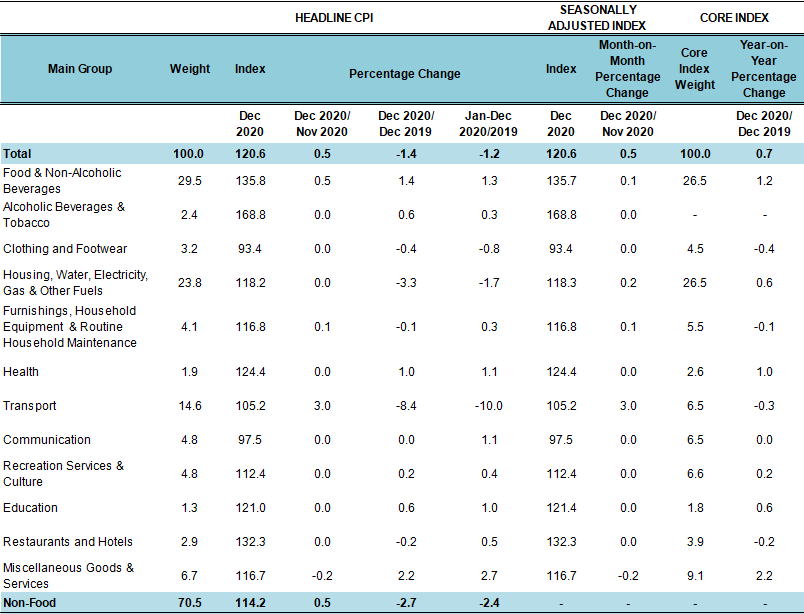
Consumer Price Index (CPI) declined 1.4 per cent in December 2020 to 120.6 as against 122.3 in the same month of the preceding year. The decrease in the overall index was attributed by the decline in Transport (-8.4%); Housing, Water, Electricity, Gas & Other Fuels (-3.3%); Clothing & Footwear (-0.4%); Restaurants & Hotels (-0.2%) and Furnishings, Household Equipment & Routine Household Maintenance (-0.1%) which contributed 48.6 per cent to overall weight.
Nevertheless, Food & Non-Alcoholic Beverages increased by 1.4 per cent to 135.8 as compared to 133.9 in corresponding month of the preceding year. This group contributes 29.5 per cent of CPI weight. Similarly, Miscellaneous Goods & Services inclined by 2.2 per cent, followed by Health (1.0%), Alcoholic Beverages & Tobacco (0.6%), Education (0.6%) and Recreation Services & Culture (0.2%).
Chart 1: Percentage Change of Consumer Price Index by Main Group
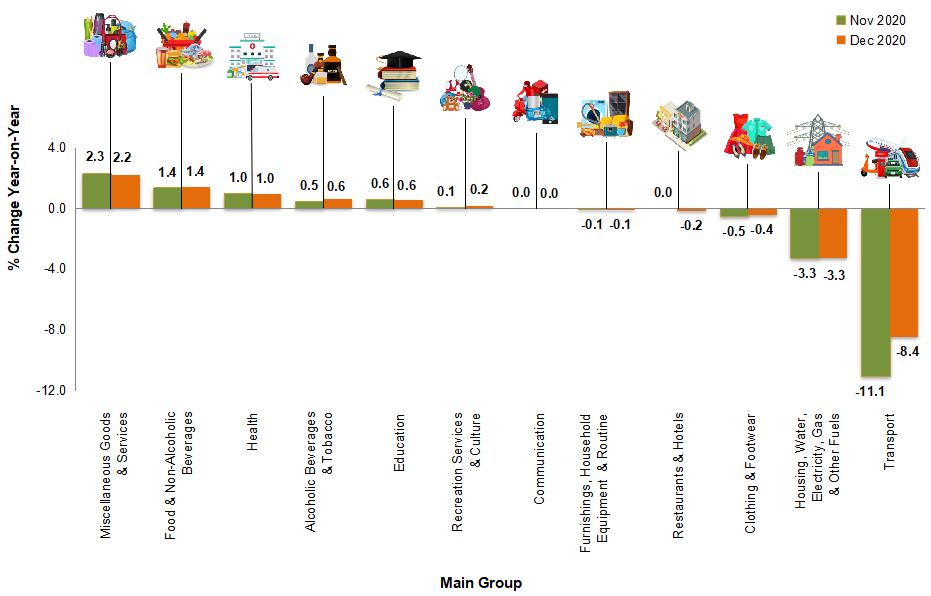
Although year-on-year CPI decreased, CPI on a monthly basis increased by 0.5 per cent as compared to November 2020. The increase was attributed by Transport (3.0%) and Alcoholic Beverages & Tobacco (0.5%).
Meanwhile, CPI for the fourth quarter of 2020 decreased 1.5 per cent to 120.3 as compared to 122.1 in the same quarter of the previous year. On a quarterly basis, the CPI increased 0.2 per cent as compared to the third quarter of 2020.
The CPI for the year 2020 registered a decrease of 1.2 per cent as compared to last year.
Index for Group Food and Non-Alcoholic Beverages
Table 1: Percentage Change for Subgroup Food & Non-Alcoholic Beverages
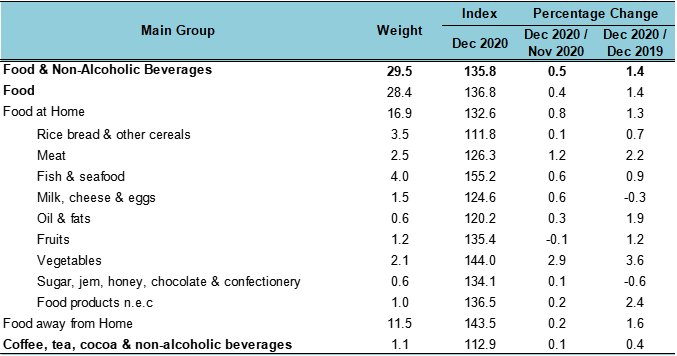
The index for Food & Non-Alcoholic Beverages increased 1.4 per cent in December 2020 as compared to the same month of the previous year. Among the subgroup that showed an increase include Vegetables (3.6%), Food products not elsewhere classified (2.4%), Meat (2.2%), Oil & fats (1.9%), Fruits (1.2%), Fish & seafood (0.9%), and Rice bread & other cereals (0.7%).
Among the index of goods which recorded year-on-year price increase in most states were Ginger (24.3%), Bird’s eye chilli (17.5%), Fresh chilli red (15.6%), Fresh chilli green (12.3%) and Round cabbage (12.1%).
Meanwhile, the index for Food away from Home increased 1.6 per cent in December 2020 as against December 2019. The increase in price of Cooked beef, Burger, Cooked fish and Satay contributed to the increase of the index of this subgroup.
Consumer Price Index by State
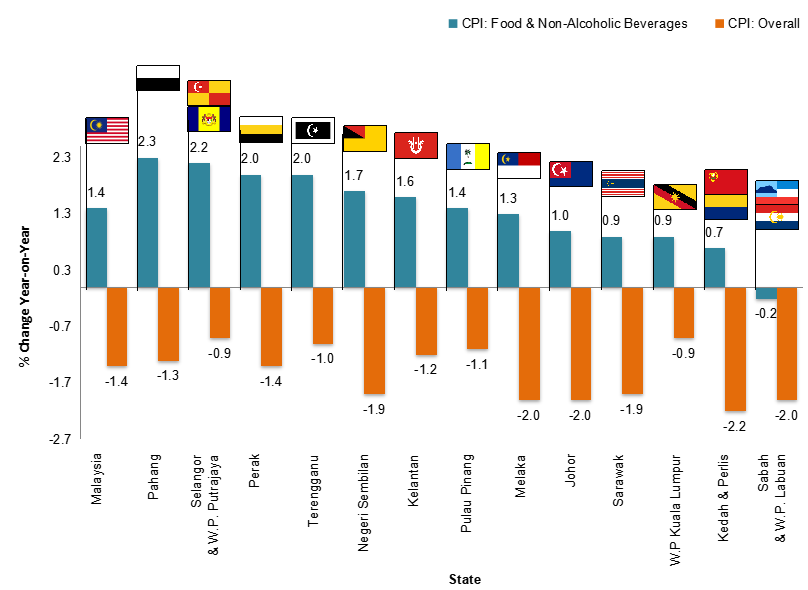
The index for all states decreased between -0.9 to -2.2 per cent in December 2020 as compared to December 2019. The highest decrease was recorded by Kedah & Perlis at -2.2 per cent. This was followed by Sabah & Wilayah Persekutuan Labuan (-2.0%), Johor (-2.0%), Melaka (-2.0%), Sarawak (-1.9%) and Negeri Sembilan (-1.9%).
However, all states registered an increase in the index of Food & Non-Alcoholic Beverages. The highest increase was recorded by Pahang at 2.3 per cent. This was followed by Selangor & Wilayah Persekutuan Putrajaya (2.2%), Perak (2.0%), Terengganu (2.0%) and Negeri Sembilan (1.7%).
Chart 2: Percentage Change of Food & Non-Alcoholic Beverages Group by State
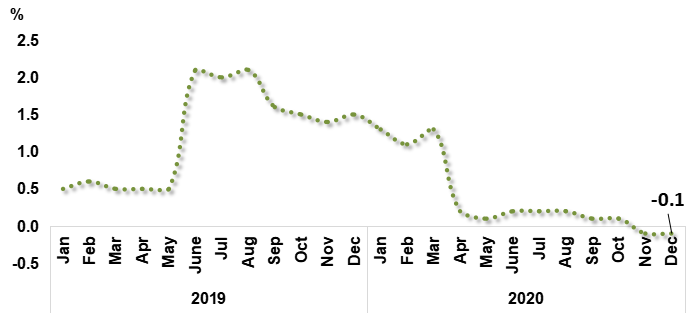
CPI without Fuel
The CPI without fuel fell 0.1 per cent in December 2020 to 112.8 as compared to 112.9 in the same month of the preceding year. CPI without fuel covers all goods and services except Unleaded Petrol RON95, Unleaded Petrol RON97 and Diesel.
Chart 3: Percentage Change of CPI without Fuel, Jan 2019 - December 2020
Core Index
Core index rose 0.7 per cent in December 2020 as compared to the same month of the previous year. Among the major groups which influenced the increase were Miscellaneous Goods & Services (2.2%), Food & Non-Alcoholic Beverages (1.2%), Health (1.0%), Housing, Water, Electricity, Gas & Other Fuels (0.6%) and Education (0.6%).
Core index excludes most volatile items of fresh food as well as administered prices of goods and services.
Table 2: Percentage Change of Headline CPI, Seasonally Adjusted Index and
Core Index by Main Group
Annex 1: Average Price for Selected Items in Malaysia, December 2020 (RM)
The full publication of the Consumer Price Index Malaysia, December 2020 can be downloaded from eStatistik portal.
Released By:
DATO' SRI DR. MOHD UZIR MAHIDIN
CHIEF STATISTICIAN MALAYSIA
DEPARTMENT OF STATISTICS, MALAYSIA
![]() DrUzir_Mahidin
DrUzir_Mahidin ![]()
![]() Dr_Uzir
Dr_Uzir
22 January 2021
Contact person:
Mohd Yusrizal bin Ab. Razak
Public Relation Officer
Strategic Communication and International Division
Department of Statistics, Malaysia
Tel : +603-8885 7942
Fax : +603-8888 9248
E-mail : yusrizal.razak[at]dosm.gov.my
Subscribe
Newsletter
Subscribe to our newsletter and stay updated
For interviews, press statement and clarification to the media, contact:
Baharudin Mohamad
Public Relation Officer
Email: baharudin[at]dosm.gov.my
Phone: 03 8090 4681
Not found what you looking for? Request data from us, through
Go to eStatistik
Email: data[at]dosm.gov.my
Phone: 03 8885 7128 (data request)


