
Consumer Price Index
- Home
- Statistics
- Economy
- Prices
- Consumer Price Index
Consumer Price Index Malaysia August 2016
Consumer Price Index Malaysia July 2016 20 July 2016
Consumer Price Index Malaysia June 2016 15 June 2016
Consumer Price Index Malaysia May 2016 20 May 2016
Consumer Price Index Malaysia April 2016 20 April 2016
Consumer Price Index Malaysia March 2016 25 March 2016
Consumer Price Index Malaysia February 2016 Show all release archives
Overview
SUMMARY OF FINDINGS

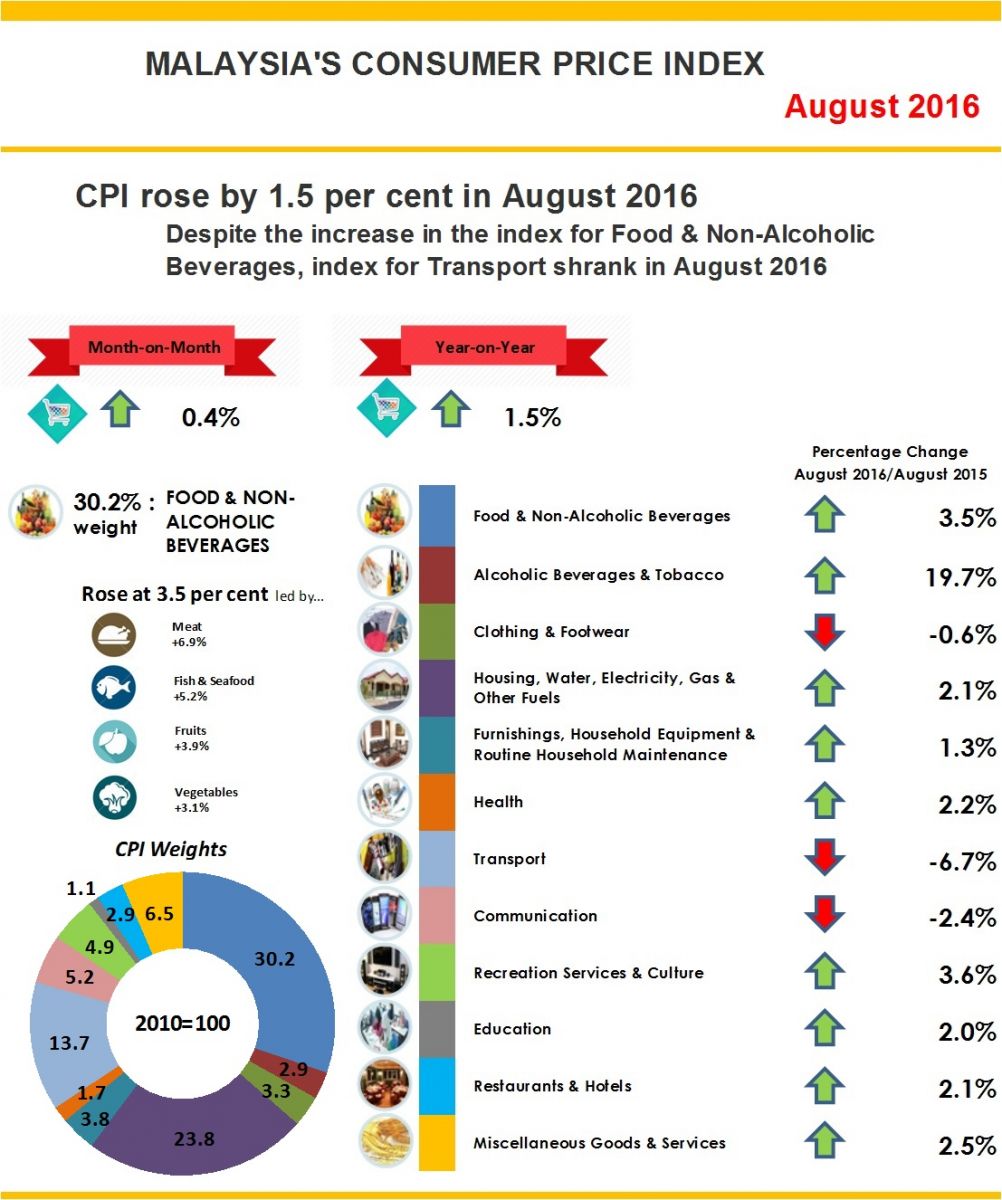
On a monthly basis, CPI for August 2016 increased 0.4 per cent to 115.6 from 115.1. CPI for the period January to August 2016 registered an increase of 2.3 per cent as compared to the same period last year.

Monthly Changes for CPI
When compared with the previous month, CPI for August 2016 increased 0.4 per cent to 115.6 from 115.1. Of the twelve major groups, seven recorded increases, two registered a decline while three remained unchanged. Among the main groups that recorded increases were Recreation Services & Culture (+2.1 per cent); Transport (+0.8 per cent); Housing, Water, Electricity, Gas & Other Fuels (+0.4 per cent); Health (+0.3 per cent), Food & Non-Alcoholic Beverages (+0.2 per cent) and Restaurants & Hotel (+0.2 per cent).
Based on a seasonally adjusted term, the CPI for August 2016 increased by 0.4 per cent as compared to July 2016 (Table 1).
Table 1 : CONSUMER PRICE INDEX FOR MAIN GROUPS, MALAYSIA (2010=100)
|
Group
|
Wt.
|
Index
|
Year-on-Year Percentage Change
|
Month-on-Month Percentage Change
|
Seasonally Adjusted Index
|
||||
|
Aug 2016
|
July 2016/ July 2015
|
Aug 2016/ Aug 2015
|
Jan - Aug 2016/2015
|
July 2016/
June 2016 |
Aug 2016/
July 2016 |
Aug 2016 | % Change Aug 2016/ July 2016 | ||
| TOTAL |
100.0
|
115.6 | 1.1 | 1.5 | 2.3 | 0.3 | 0.4 | 115.6 | 0.4 |
| Food & Non-Alcoholic Beverages | 30.2 | 124.7 | 3.8 | 3.5 | 4.2 | 0.3 | 0.2 | 124.6 | 0.3 |
| Alcoholic Beverages & Tobacco | 2.9 | 165.3 | 19.9 | 19.7 | 21.4 | 0.1 | -0.1 | 165.3 | -0.1 |
| Clothing & Footwear | 3.3 | 98.2 | -0.6 | -0.6 | -0.3 | -0.2 | -0.2 | 98.2 | -0.2 |
| Housing, Water, Electricity, Gas & Other Fuels | 23.8 | 114.6 | 2.4 | 2.1 | 2.6 | 0.0 | 0.4 | 114.4 | 0.1 |
| Furnishings, Household Equip. & Routine Household Maintenance | 3.8 | 112.1 | 1.5 | 1.3 | 2.9 | 0.2 | 0.0 | 112.1 | 0.0 |
| Health | 1.7 | 118.1 | 2.0 | 2.2 | 3.0 | 0.1 | 0.3 | 118.1 | 0.3 |
| Transport | 13.7 | 102.5 | -9.9 | -6.7 | -5.2 | 1.5 | 0.8 | 102.5 | 0.8 |
| Communication | 5.2 | 98.1 | -2.3 | -2.4 | -1.1 | 0.0 | 0.0 | 98.1 | 0.0 |
| Recreation Services & Culture | 4.9 | 111.1 | 1.7 | 3.6 | 2.2 | 0.5 | 2.1 | 111.1 | 2.1 |
| Education | 1.1 | 115.0 | 2.2 | 2.0 | 2.3 | 0.1 | 0.0 | 115.1 | 0.1 |
| Restaurants & Hotels | 2.9 | 125.4 | 2.1 | 2.1 | 3.2 | 0.2 | 0.2 | 125.4 | 0.2 |
| Miscellaneous Goods & Services | 6.5 | 113.2 | 2.4 | 2.5 | 3.5 | 0.4 | 0.1 | 113.2 | 0.1 |
| Non-Food | 69.8 | 111.7 | -0.2 | 0.6 | 1.4 | 0.2 | 0.5 | 111.7 | 0.5 |
Among the index of food items which recorded notable increases in August 2016 compared with the previous month were Tomatoes (+6.8 per cent); Spinach (+5.2 per cent); Choy Sam (+4.1 per cent); Watermelon (+3.5 per cent); Hen's Egg (+3.1 per cent); Indian Mackerel (Fish) (+0.8 per cent) and Prawn (+0.6 per cent).
Meanwhile, decreases were registered in the index of some food items such as Round Cabbage (-7.5 per cent); Carrot (-6.8 per cent); Red Chillies (-5.5 per cent); Cucumber (-4.4 per cent), Long Bean (-2.8 per cent) and Cuttlefish (-2.4 per cent).
Table 2 : Consumer Price Index for Sub-Groups of Food and Non-Alcoholic Beverages, Malaysia (2010=100)
| Sub-Groups | Wt. | Index | Year-on-Year Percentage Change | Month-on-Month Percentage Change | |||
|
Aug 2016
|
July 2016/
July 2015
|
Aug 2016/
Aug 2015
|
Jan - Aug 2016/2015 |
July 2016/
June 2016
|
Aug 2016/
July 2016
|
||
| Food & Non-Alcoholic Beverages | 30.2 | 124.7 | 3.8 | 3.5 | 4.2 | 0.3 | 0.2 |
| Food | 29.0 | 125.3 | 3.9 | 3.6 | 4.4 | 0.3 | 0.2 |
| Food At Home | 17.9 | 124.8 | 4.2 | 3.7 | 4.5 | 0.3 | 0.1 |
| Rice, Bread & Other Cereals | 3.7 | 108.5 | 0.7 | 0.7 | 1.2 | 0.0 | 0.2 |
| Meat | 2.8 | 128.4 | 7.0 | 6.9 | 3.7 | 4.5 | 0.3 |
| Fish & Seafood | 4.3 | 138.5 | 6.0 | 5.2 | 7.1 | 0.6 | -0.2 |
| Milk & Eggs | 1.6 | 124.9 | 1.2 | 2.2 | 0.9 | -0.7 | 0.8 |
| Oils & Fats | 0.5 | 102.3 | 0.4 | 0.5 | 0.5 | 0.1 | 0.4 |
| Fruits | 1.1 | 127.1 | 4.5 | 3.9 | 5.8 | 0.6 | 0.4 |
| Vegetables | 2.4 | 126.1 | 6.3 | 3.1 | 8.8 | -3.6 | -0.5 |
| Sugar, Jam, Honey, Chocolate & Confectionary | 0.6 | 134.5 | 1.9 | 1.9 | 2.4 | 0.1 | 0.1 |
| Food Products n.e.c | 0.9 | 127.5 | 5.8 | 6.2 | 5.9 | 0.2 | 0.6 |
| Food Away From Home | 11.1 | 126.1 | 3.1 | 3.4 | 4.0 | 0.2 | 0.6 |
| Coffee, Tea, Cocoa & Non-Alcoholic Beverages | 1.2 | 111.9 | 0.5 | 0.5 | 1.9 | -0.3 | 0.3 |
CPI changes for the period January – August 2016 / 2015
The increase of 4.2 per cent in the index for Food & Non-Alcoholic Beverages was the result of increases for Food At Home (+4.5 per cent); Food Away From Home (+4.0 per cent) and Coffee, Tea, Cocoa & Non-Alcoholic Beverages (+1.6 per cent). Among the subgroups of Food At Home which showed significant increases during this period as shown in Table 2 were Vegetables (+8.8 per cent); Fish & Seafood (+7.1 per cent); Fruits (+5.8 per cent) and Meat (+3.7 per cent).
CPI Changes by States
Five states recorded higher increases above the national level index for August 2016 compared to the same month in 2015. The five states were Wilayah Persekutuan Kuala Lumpur (+2.5 per cent); Johor (+1.9 per cent); Pulau Pinang (+1.7 per cent); Selangor & Wilayah Persekutuan Putrajaya (+1.6 per cent) and Melaka (+1.6 per cent). Meanwhile, the remaining states have recorded an increase at par or lower than the national level index.Core Inflation
Table 3 : Headline CPI and Core Index by Main Groups, Malaysia (2010=100)
|
Group
|
Wt.
|
HEADLINE CPI
|
CORE INDEX | |||
| Index | Percentage Change | Core Index | Percentage Change | |||
| Aug 2016 |
Aug 2016/ |
Aug 2016/ |
Wt. |
Aug 2016/ |
||
| TOTAL | 100.0 | 115.6 | 0.4 | 1.5 | 100.0 | 2.2 |
| Food & Non-Alcoholic Beverages | 30.2 | 124.7 | 0.2 | 3.5 | 26.3 | 2.5 |
|
Alcoholic Beverages & Tobacco
|
2.9 | 165.3 | -0.1 | 19.7 | - | - |
| Clothing & Footwear | 3.3 | 98.2 | -0.2 | -0.6 | 4.6 | -0.6 |
| Housing, Water, Electricity, Gas & Other Fuels | 23.8 | 114.6 | 0.4 | 2.1 | 26.8 | 2.4 |
| Furnishings, Household Equipment & Routine Household Maintenance | 3.8 | 112.1 | 0.0 | 1.3 | 5.2 | 1.3 |
| Health | 1.7 | 118.1 | 0.3 | 2.2 | 2.3 | 2.2 |
| Transport | 13.7 | 102.5 | 0.8 | -6.7 | 6.7 | 4.7 |
| Communication | 5.2 | 98.1 | 0.0 | -2.4 | 7.2 | -2.4 |
| Recreation Services & Culture | 4.9 | 111.1 | 2.1 | 3.6 | 6.6 | 3.6 |
|
Education
|
1.1 | 115.0 | 0.0 | 2.0 | 1.5 | 2.0 |
| Restaurant & Hotel | 2.9 | 125.4 | 0.2 | 2.1 | 3.9 | 2.1 |
| Miscellaneous Goods & Services | 6.5 | 113.2 | 0.1 | 2.5 | 8.9 | 2.5 |

Released By:
THE OFFICE OF CHIEF STATISTICIAN MALAYSIA
DEPARTMENT OF STATISTICS, MALAYSIA
21 September 2016
Contact person:
Ho Mei Kei
Public Relation Officer
Corporate and User Services Division
Department of Statistics, Malaysia
Tel : +603-8885 7942
Fax : +603-8888 9248
Email : mkho[at]stats.gov.my
Subscribe
Newsletter
Subscribe to our newsletter and stay updated
For interviews, press statement and clarification to the media, contact:
Baharudin Mohamad
Public Relation Officer
Email: baharudin[at]dosm.gov.my
Phone: 03 8090 4681
Not found what you looking for? Request data from us, through
Go to eStatistik
Email: data[at]dosm.gov.my
Phone: 03 8885 7128 (data request)


