
State Socioeconomic
- Home
- Statistics
- Economy
- National Accounts
- State Socioeconomic
State Socioeconomic Report 2018
Overview
INTRODUCTION
Malaysia’s Gross Domestic Product (GDP) has been rebased from 2010 to 2015 base year. Rebasing of GDP is a normal statistical procedure performed by National Statistical Office around the world to ensure the statistics reflect the current economic structure. Subsequently, the rebasing exercise has also been implemented to the compilation of GDP by state.
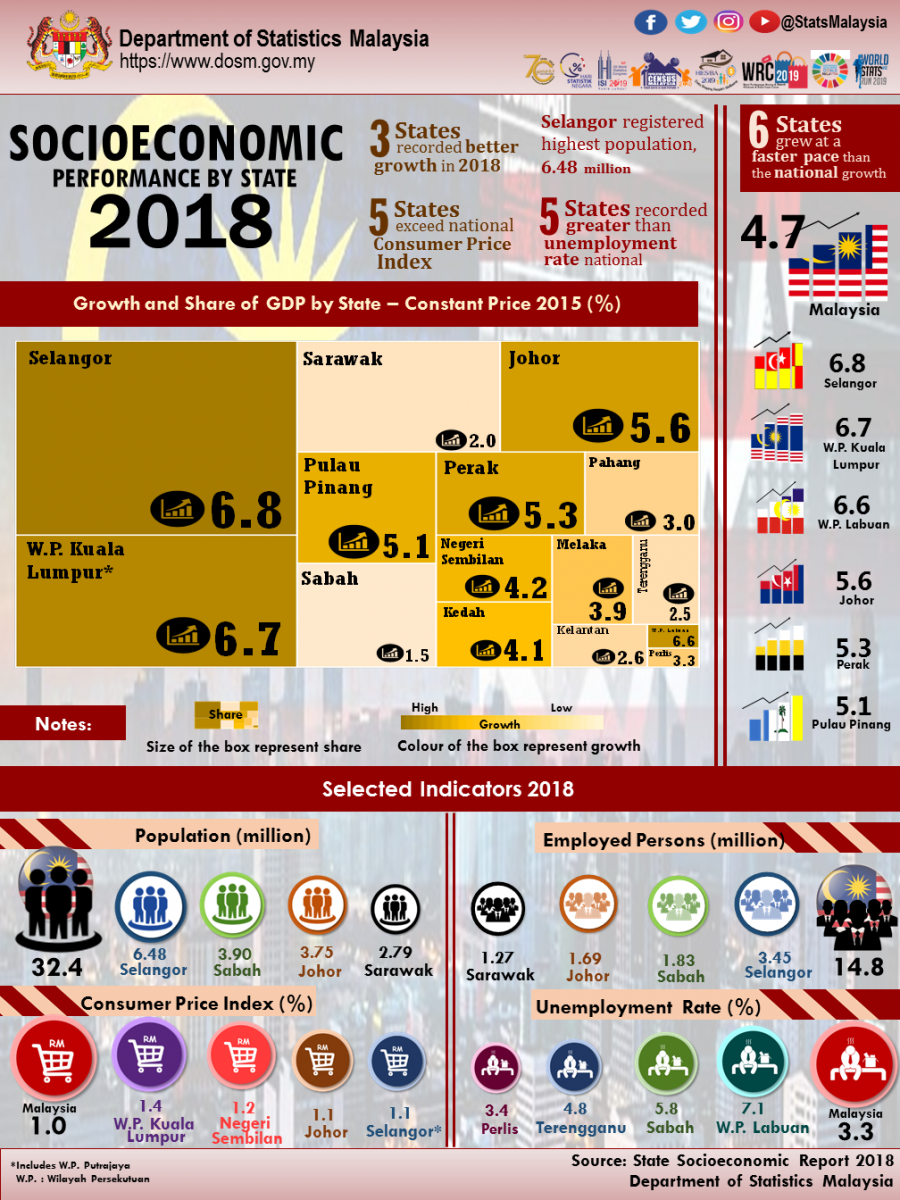
For the year 2018, Malaysia’s economy grew 4.7 per cent at 2015 constant prices as compared to 5.7 per cent in 2017. All sectors posted a positive growth with the exception of Mining & quarrying. Services and Manufacturing sectors served as the main contributors to the economy with a combined share of 79.1 per cent.
GDP CONTRIBUTION BY STATE
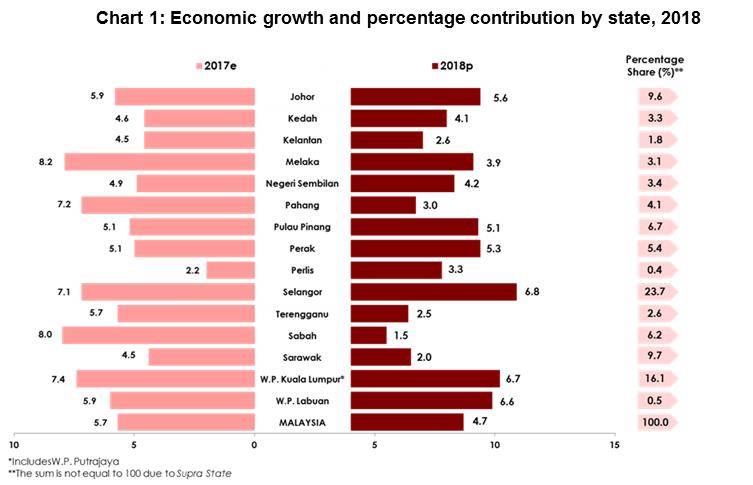
Six states maintained as the major contributors to the national GDP in 2018 with 72.1 per cent as compared to 71.7 per cent in the previous year with an increase of 0.4 per cent. Selangor recorded the highest contribution of 23.7 per cent followed by W.P. Kuala Lumpur (16.1%), Sarawak (9.7%), Johor (9.6%), Pulau Pinang (6.7%) and Sabah (6.2%) as depicted in Chart 1.
ECONOMIC PERFORMANCE BY STATE 2018
Six states grew at a faster pace than the national growth (4.7%) in 2018 namely Selangor (6.8%), W.P. Kuala Lumpur (6.7%), W.P. Labuan (6.6%), Johor (5.6%), Perak (5.3%) and Pulau Pinang (5.1%). The growth was driven by a better performance in Services sector as well as a sustained growth in Manufacturing. Meanwhile, the economic growth for commodity based states resulted in the slower growth than the national growth.
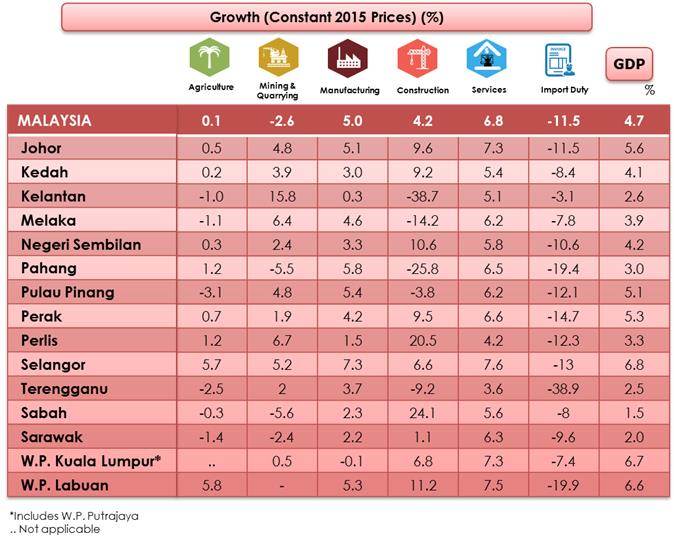
Johor recorded a growth of 5.6 per cent (2017: 5.9%) stimulated by Services, Manufacturing and Construction sectors. Services sector expanded to 7.3 per cent (2017: 6.6%) driven by wholesale & retail trade, utilities, communication and transportation sub sectors. Manufacturing sector eased to 5.1 per cent as compared to 6.9 per cent in 2017 attributed by electrical, electronic and optical product. Construction sector elevated to 9.6 per cent (2017: -6.4%) stimulated by civil engineering and non-residential sub-sectors. Meanwhile, Agriculture sector posted a slower growth at 0.5 per cent (2017: 7.6%) in 2018 due to a reduction in oil palm sub sector to negative 2.1 percent as compared to 17.3 per cent in the preceding year.
Kedah registered a growth of 4.1 per cent in 2018 (2107: 4.6%). Services sector grew at 5.4 per cent ( 2017: 5.3%) led by wholesale & retail and information & communication sub-sectors. The growth of 3.0 per cent (2017: 4.3%) in Manufacturing sector was supported by a slower growth in electrical, electronic and optical sub-sector. Agriculture sector increase slower at 0.2 per cent (2017: 5.1%) resulted from negative growth in rubber and palm oil sub-sectors.
Kelantan grew 2.6 per cent as compared to 4.5 per cent in the previous year. Services sector increased to 5.1 per cent (2017: 4.9%) backed by wholesale & retail trade and government services sub sectors. However, Agriculture sector declined to negative 1.0 per cent (2017: 3.4%) due to the decrease in production of rubber and palm oil. The slower growth in electrical, electronic and optical sub-sector has slowed down Manufacturing sector to 0.3 per cent in 2018 (2017: 9.0%).
Melaka moderated to 3.9 per cent in 2018 as compared to 8.2 per cent in the previous year. Services sector surged to 6.2 per cent (2017: 5.4%) attributed by wholesale & retail trade and communication sub sectors. Manufacturing sector grew at 4.6 per cent (2017: 6.8%) spurred by electrical, electronic & optical and motor vehicles & transport equipment. Nevertheless, Agriculture and Construction sectors declined to negative 1.1 per cent (2017: 7.0%) and negative 14.2 per cent (2017: 72.4%) respectively. The decline in Agriculture sector were influenced by oil palm and rubber sub sectors.
Negeri Sembilan stood at 4.2 per cent (2017: 4.9%) driven by Services and Manufacturing sectors. Services sector lifted up to 5.8 per cent (2017: 4.6%) contributed by a better growth in wholesale & retail trade and utilities sub sectors. Manufacturing sector grew 3.3 per cent (2017: 3.2%) supported by a resilient growth in refined petroleum products and electrical, electronic & optical sub sectors. However, Construction and Agriculture sectors which registered 10.6 per cent (2017: 17.0%) and 0.3 per cent (2017: 8.6%) respectively have also influenced the overall performance of Negeri Sembilan’s economy.
In 2018, Pahang grew 3.0 per cent from 7.2 per cent in preceding year. Services sector grew to 6.5 per cent (2017: 6.1%) led by wholesale & retail trade, other private services and government services sub sectors. Manufacturing sector surged to 5.8 per cent (2017: 6.6%) impelled by chemicals & chemical products sub sector. Nevertheless, Agriculture sector posted a slower growth at 1.2 per cent (2017: 9.3%) due to the decrease of growth in oil palm sub sector to negative 5.2 per cent (2017: 19.1%). In addition, Construction sector also declined to negative 25.8 per cent which resulted from the contraction in non-residential and civil engineering activities.
Pulau Pinang sustained at 5.1 per cent in 2018 attributed by Services and Manufacturing sectors. Services sector rose to 6.2 per cent (2107: 5.5%) led by wholesale & retail trade and communications sub sectors. Meanwhile, Manufacturing sector recorded a growth of 5.4 per cent (2017: 5.7%) driven by electrical, electronic & optical products as well as non-metallic mineral products.
Perak recorded a better economic performance to 5.3 per cent from 5.1 per cent in 2017, supported by the increase in the Services and Construction sector. Services sector expanded to 6.6 per cent (2017: 5.4%) spearheaded by wholesale & retail trade and utilities sub sectors. Construction sector elevated to 9.5 per cent (2017: -24.2%) stimulated by the value of construction work done in non-residential and civil engineering segments. Meanwhile, the Manufacturing sector moderated to 4.2 per cent (2017: 8.0%) influenced by the electrical, electronic & optical as well as vegetable and animal oils & fats. Agriculture sector grew at 0.7 per cent (2017: 7.8%) driven by a reduction in oil palm production.
Perlis grew by 3.3 per cent as compared to 2.2 per cent in 2017. Services sector rose 4.2 per cent (2017: 4.0%) backed by wholesale & retail trade and government services sub sectors. Construction sector recorded a commendable growth to 20.5 per cent (2017: -42.8%) driven by the special trade activities while slower growth in Agriculture sector by 1.2 per cent (2017: 4.0%) was affected by the decrease in marine fisheries sub sectors. Manufacturing sector grew at 1.5 per cent as compared to 2.3 per cent in 2017.
Selangor remained strong at a growth of 6.8 per cent compared to 7.1 per cent in 2017. Services sector grew 7.6 per cent (2017: 6.8%) fueled by wholesale & retail trade, communications and finance sub-sectors. Manufacturing sector, which recorded a growth of 7.3 per cent (2017: 7.9%), was driven by the performance of the electrical, electronics & optical products and motor vehicles & transport equipment sub-sectors. In addition, Construction sector recorded a growth of 6.6 as compared to 8.2 percent in 2017.
Terengganu moderated to 2.5 per cent as compared to 5.7 per cent in 2017 supported by Services and Manufacturing sectors. Services grew to 3.6 per cent (2017: 4.3%) contributed by the performance of wholesale & retail trade and utilities sub sectors. Additionally, Manufacturing sector recorded a growth of 3.7 per cent from 3.9 per cent in the previous year influenced by refined petroleum products and chemical & chemical products. In addition, Agriculture sector declined to negative 2.5 per cent (2017: 8.9%) due to the decrease in rubber and oil palm production.
Sabah recorded a slower growth of 1.5 per cent as compared to a strong growth of 8.0 per cent in the previous year. Mining & quarrying and Agriculture sectors were affected to negative 5.6 percent (2017: 15.7%) and negative 0.3 percent (2017: 4.6%) respectively. The negative growth in both sectors were influenced by the decline in the production of crude oil and natural gas as well as the reduction in oil palm production. However, an increase in Services sector to 5.6 per cent (2017: 5.5%) and the rebound in Construction sector to a double-digit growth of 24.1 per cent supported the overall economic momentum in 2018.
Sarawak grew by 2.0 per cent as compared to 4.5 per cent recorded in 2017. Services sector registered a growth of 6.3 per cent (2017: 6.2%), contributed by wholesale & retail trade sub sector while the Manufacturing sector moderated to 2.2 per cent (2017: 3.7%) influenced by the performance of refined petroleum products sub sector. Meanwhile, Mining and quarrying sector in Sarawak registered a negative 2.4 percent (2017: 3.3%) driven by negative growth in crude oil and natural gas production. Agriculture sector also decreased to negative growth of 1.4 per cent affected from the forestry and logging sub-sector.
W.P. Kuala Lumpur recorded a strong growth of 6.7 per cent (2017: 7.4%) driven by Services sector. Services sector expanded to 7.3 per cent (2017: 6.6%) backed by wholesale & retail trade, finance & insurance and business services sub sectors. However, Construction sector posted a slower growth of 6.8 per cent (2017: 13.1%) influenced by civil engineering and special trade activities.
W.P. Labuan elevated to 6.6 per cent (2017: 5.9%) underpinned by Services and Manufacturing sectors. The Services sector grew by 7.5 per cent (2017: 5.2%) spurred by the increase in finance and insurance sub sector. Meanwhile, the Manufacturing sector also recorded a better growth of 5.3 per cent (2017: 3.2%) boosted by the chemicals & chemical products and basic metals sub sectors. Construction sector expanded to 11.2 per cent as compared to 12.6 per cent recorded in 2017.
GDP PER CAPITA
GDP per capita at national level increased to RM44,682 in 2018 as compared to RM42,834 in the previous year. Six states recorded GDP per capita surpassed the national level, led by W.P. Kuala Lumpur (RM121,293), W.P. Labuan (RM74,337), Penang (RM52,937), Sarawak (RM52,301), Selangor (RM51,528) and Melaka (RM47,960) as shown in Table 1.

Meanwhile, two states recorded a decline in GDP per capita which are Pahang with the value of RM35,554 (2017: RM35,754) and Kelantan RM13,668 (2017: RM13,700). The decline in GDP per capita of these two states is largely due to the decline in production and prices of oil palm and rubber commodity as well as a negative performance in the Construction sector.
CONSUMER PRICE INDEX
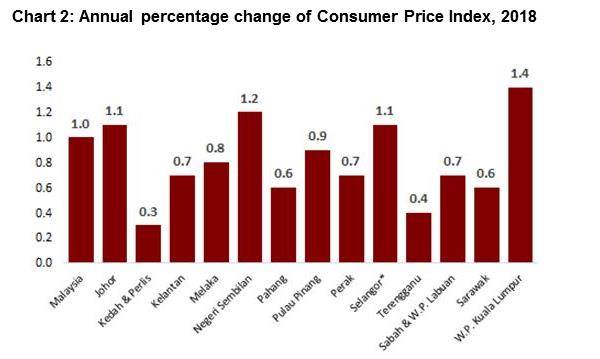
Consumer Price Index (CPI) grew at a slower pace to 1.0 per cent as compared to 3.7 per cent in 2017. In 2018, four states surpassed the national inflation rate namely W.P Kuala Lumpur (1.4%), Negeri Sembilan (1.2%) as well as Johor and Selangor (1.1%) as depicted in Chart 2.
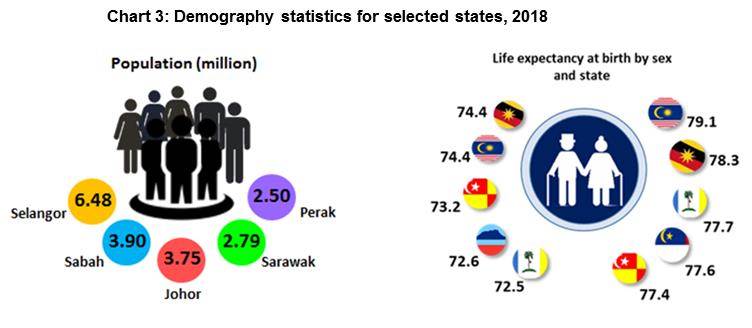
DEMOGRAPHY
Malaysia recorded a total of 32.38 million population in 2018. The highest population was registered by Selangor with 6.48 million, which covers 20.0 per cent from the overall population in Malaysia. It was followed by Sabah and Johor with 3.90 million and 3.75 million respectively (Chart 3). Total contribution of these three states was 43.6 from the Malaysia’s population.
On the other hand, the highest life expectancy at birth was posted by Sarawak and W.P Kuala Lumpur with 74.4 years for male and 79.1 years for female in W.P Kuala Lumpur while the lowest was in Perlis with 69.1 years (male) and 74.5 years (female).
LABOUR FORCE
Labour force in Malaysia increased 2.0 per cent to approximately 15.3 million persons in 2018 as compared to 15.0 million persons in 2017. Selangor owned the highest number of employed persons with 3.4 million, followed by Sabah and Johor which recorded 1.8 million and 1.7 million employed persons respectively (Chart 4).
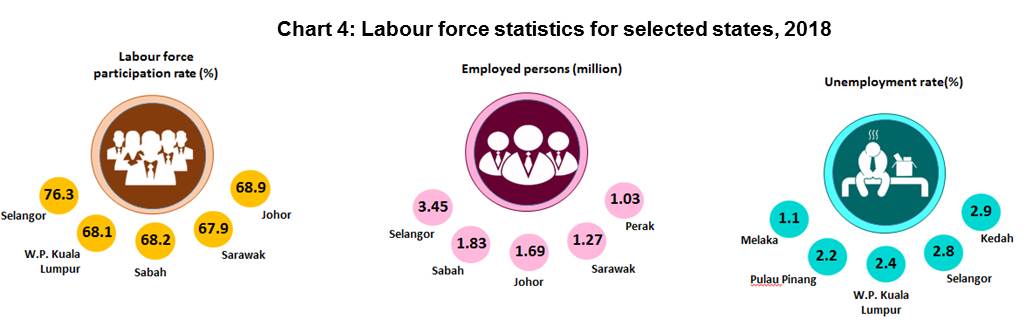
Labour force participation rate (LFPR) rise 0.3 percentage points to 68.3 per cent as compared to 68.0 per cent in 2017. At the state level, LFPR in Selangor increased to 76.3 per cent while W.P. Kuala Lumpur recorded 68.1 per cent.
On the other hand, Melaka recorded the lowest unemployment rate in 2018 with 1.1 per cent. Amongst states with unemployment rate below the national level (3.3%) were Johor, Pulau Pinang, Kedah, Negeri Sembilan and Selangor.
STATE GOVERNMENT & LOCAL AUTHORITIES’ STATISTICS
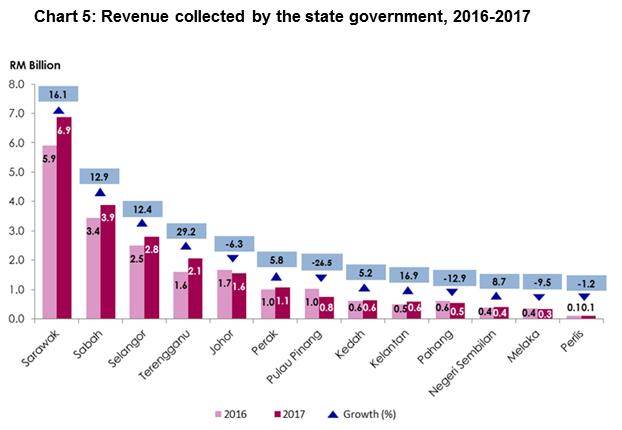
Revenue of state government
Sarawak’s state government recorded the highest revenue in 2017 amounted to RM6.9 billion, increased by RM954.2 million or 16.1 per cent as compared to RM5.9 billion in the preceding year (Chart 5). The increase was primarily contributed by non-tax revenue which grew 15.6 per cent to RM5.1 billion. Second highest revenue collected by the Sabah’s state government with RM3.9 billion with an increase of RM444.4 million as compared to the RM3.4 billion collected in 2016. On the other hand, revenue of Selangor’s state government increased 12.4 per cent to RM2.8 billion as compared to RM2.5 billion in 2016.
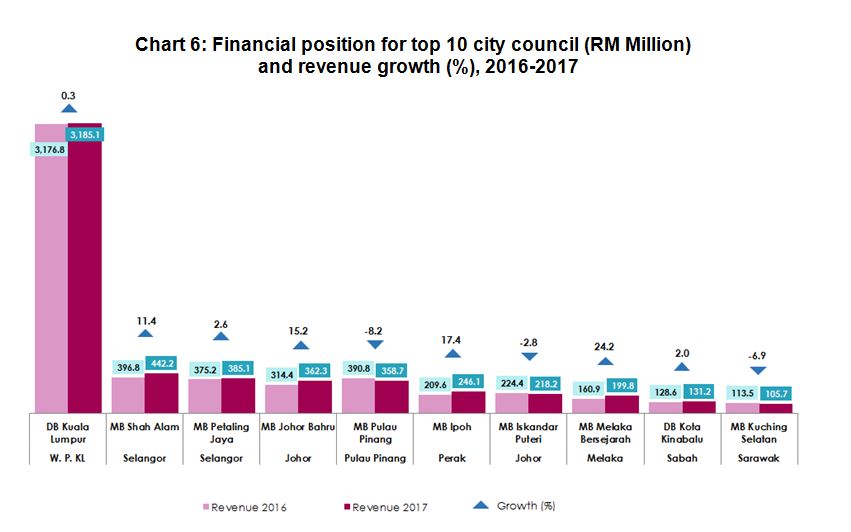
City council
Out of 14 city councils, 10 city councils recorded the highest financial position which involving local authorities from W.P Kuala Lumpur, Selangor, Johor, Pulau Pinang, Perak, Melaka, Sabah and Sarawak. Generally, seven city councils posted a better performance in 2017. However, three city councils showed slower performance which consists of Majlis Bandaraya Pulau Pinang, Majlis Bandaraya Iskandar Puteri and Majlis Bandaraya Kuching Selatan as in Chart 6.
From the revenue aspect, Dewan Bandaraya Kuala Lumpur (DBKL) recorded highest revenue of RM3.2 billion with a growth of 0.3 per cent in 2017. In addition, two city councils in Selangor which are Majlis Bandaraya Shah Alam and Majlis Bandaraya Petaling Jaya recorded revenue of RM442.2 million and RM385.1 million respectively.
District council
Out of 95 district council, 10 district council involving five states which are Selangor, Johor, Sabah, Kedah and Perak recorded the highest financial position.
In Selangor, 4 district council recorded highest financial position as compared to the others. Majlis Daerah Hulu Selangor recorded a revenue of RM83.5 million in 2017 with a growth of 1.2 per cent (Chart 7). It was followed by Majlis Daerah Kuala Langat (RM63.2 million), Majlis Daerah Kuala Selangor (RM61.6 million) and Majlis Daerah Sabak Bernam (RM22.1 million). On the other hand, in Johor, Majlis Daerah Pontian, Majlis Daerah Segamat and Majlis Daerah Tangkak posted a positive growth of 15.5 per cent, 18.5 per cent and 21.2 per cent respectively.
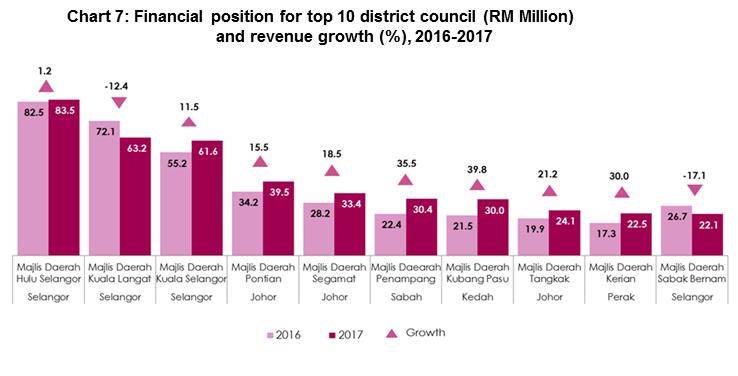
Majlis Daerah Penampang in Sabah increased 35.5 per cent with a revenue of RM30.4 million. In Kedah, Majlis Daerah Kubang Pasu grew 39.8 per cent with a revenue of RM30.0 million while Majlis Daerah Kerian in Perak collected a revenue of RM22.5 million in 2017.
Released By:
DATO' SRI DR. MOHD UZIR MAHIDIN
CHIEF STATISTICIAN MALAYSIA
DEPARTMENT OF STATISTICS, MALAYSIA
![]() DrUzir_Mahidin
DrUzir_Mahidin ![]()
![]() Dr_Uzir
Dr_Uzir
24 July 2019
Contact person:
Rohaida binti Mohamad
Public Relation Officer
Strategic Communication and International Division
Department of Statistics, Malaysia
Tel : +603-8885 7942
Fax : +603-8888 9248
Email : rohaida.mohamad[at]dosm.gov.my
Subscribe
Newsletter
Subscribe to our newsletter and stay updated
For interviews, press statement and clarification to the media, contact:
Baharudin Mohamad
Public Relation Officer
Email: baharudin[at]dosm.gov.my
Phone: 03 8090 4681
Not found what you looking for? Request data from us, through
Go to eStatistik
Email: data[at]dosm.gov.my
Phone: 03 8885 7128 (data request)


