
Health
- Home
- Statistics
- Economy
- Services
- Health
Services Statistics Health (Private Sector) 2015
Overview
SNAPSHOT OF HEALTH 2014
INTRODUCTION
This publication presents statistics on private health services which includes hospital services, medical & dental services and other human health services for reference year 2014. The statistics presented were compiled based on the Annual Survey of Services conducted in 2015.
PERFORMANCE OF HEALTH SERVICES BY ACTIVITY
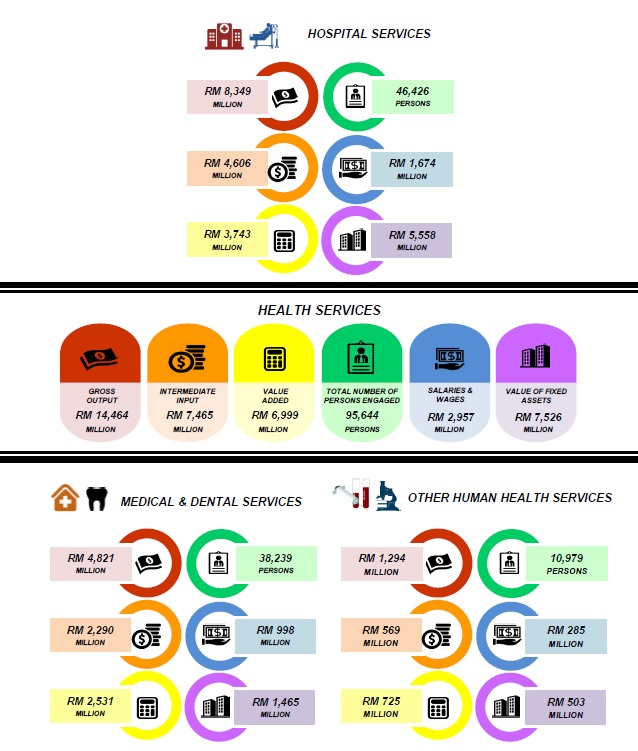
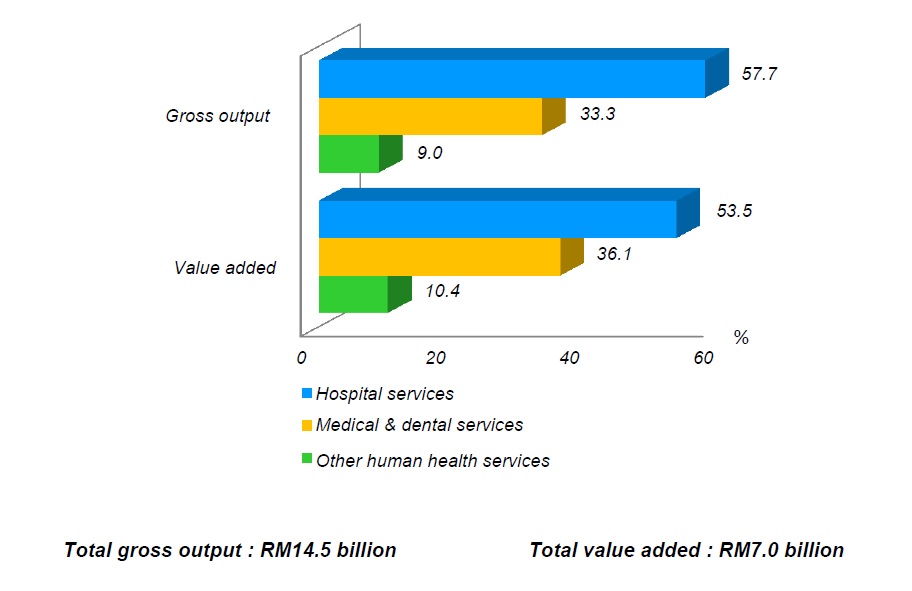
The highest gross output for private health services was contributed by hospital services registering RM8.3 billion (57.7%) to the total gross output. This was followed by medical & dental services, RM4.8 billion (33.3%) and other human health services, RM1.3 billion (9.0%) as shown in Chart 1.
Value added showed the same structure as gross output where hospital services was the highest contributor with RM3.7 billion (53.5%) of total value added. This was followed by medical & dental services which recorded RM2.5 billion (36.1%) and other human health services registering RM0.7 billion (10.4%) as illustrated in Chart 1.
Chart 1 : Percentage distribution of gross output and value added of health services by activity, 2014
Value of fixed assets owned by the establishments in private health services amounted to RM7.5 billion in 2014. Hospital services posted the highest value of fixed assets of RM5.6 billion (74.7%).
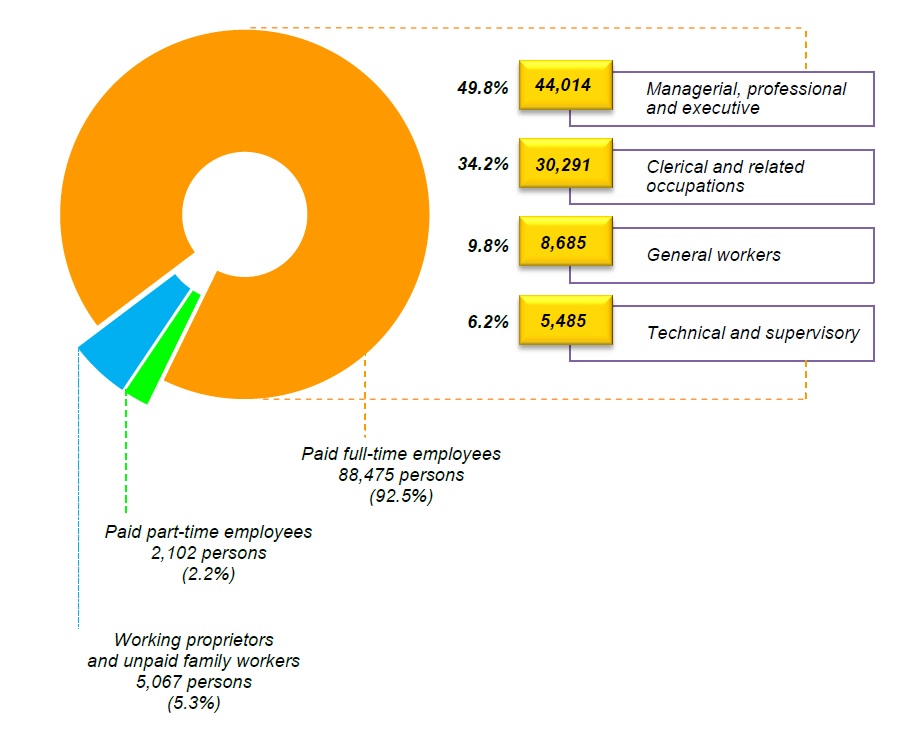
In 2014, the total number of persons engaged in private health services were 95,644 persons of which 46,426 persons (48.5%) were hired in the hospital services while 38,239 persons (40.0%) in medical & dental services and 10,979 persons (11.5%) in other human health services. Out of the total number of persons engaged, 88,475 persons (92.5%) were paid full-time employees whereas 5,067 persons (5.3%) were working proprietors and unpaid family workers. The remaining 2,102 persons (2.2%) were paid part-time employees.
Managerial, professional and executive category of paid full-time employees constituted the highest number with 44,014 persons (49.8%) followed by clerical and related occupations (34.2%), general workers (9.8%) and technical and supervisory (6.2%). The distribution of the total number of persons engaged by category of workers for the year 2014 is shown in Chart 2.
Chart 2 : Total number of persons engaged by category of workers, 2014
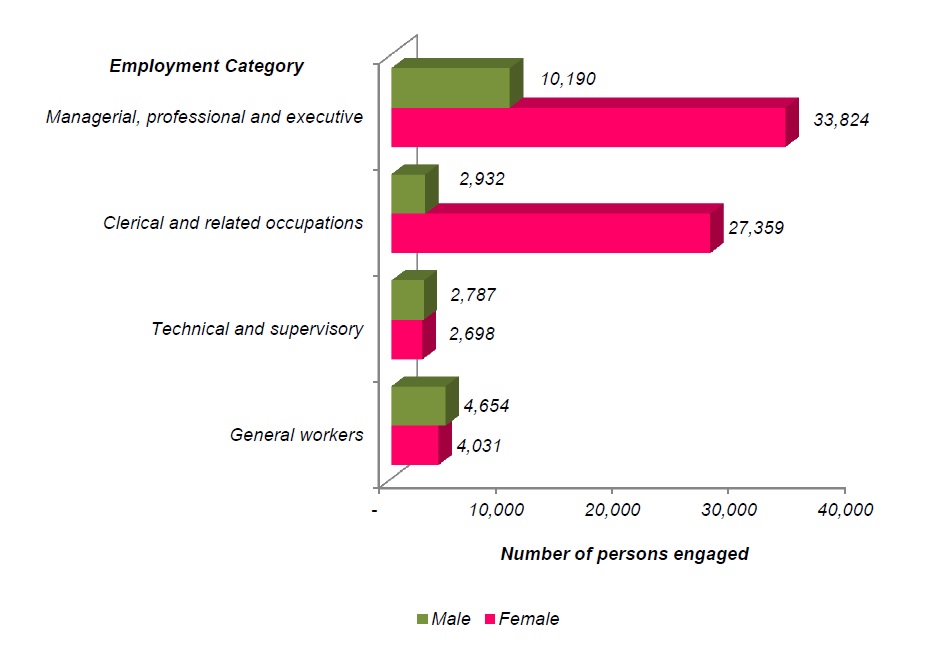
In terms of number of persons engaged by sex, female workers dominated this sub-sector with 70,827 persons (74.1%) as compared to male workers with 25.9 per cent. It was observed that female workers outnumbered male workers for paid full-time and paid part-time employees. For paid full-time employees, the number of female workers was higher than male workers in managerial, professional and executive (female: 33,824 persons; male: 10,190 persons) as well as clerical and related occupations (female: 27,359 persons; male: 2,932 persons) as illustrated in Chart 3.
Chart 3 : Number of persons engaged by category of paid full-time employees and sex, 2014
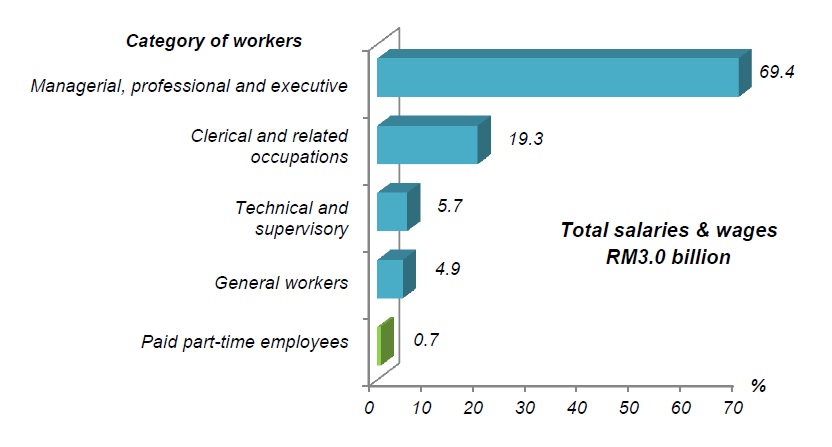
Total salaries & wages paid in 2014 stood at RM3.0 billion of which the managerial, professional and executive was the highest with RM2.1 billion (69.4%). This was followed by clerical and related occupations (19.3%), technical and supervisory (5.7%), general workers (4.9%) and paid part-time employees (0.7%) as potrayed in Chart 4.
Chart 4 : Percentage distribution of salaries & wages by category of workers, 2014
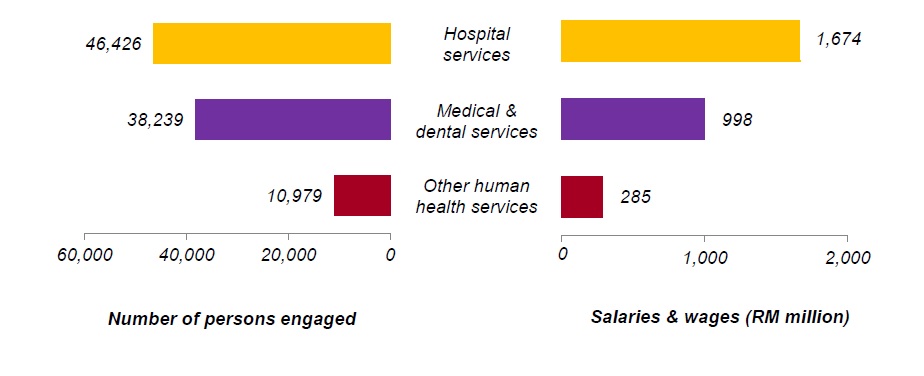
Hospital services was the main contributor to total salaries & wages paid registering RM1.7 billion (56.6%). This was followed by medical & dental services, RM1.0 billion (33.8%) and other human health services, RM0.3 billion (9.6%) as shown in Chart 5.
Chart 5 : Number of persons engaged and salaries & wages of health services by activity, 2014
PERFORMANCE OF HEALTH SERVICES BY STATE
Selangor dominated the private health services in both gross output and value added of RM3.8 billion (26.0%) and RM1.9 billion (26.8%) respectively. This was followed by W.P. Kuala Lumpur which recorded gross output of RM3.1 billion (21.3%) and value added of RM1.5 billion (21.8%). Next was Pulau Pinang which registered RM1.8 billion and RM0.9 billion of gross output and value added respectively. These three states cumulatively contributed 60.0 per cent to the gross output and 61.1 per cent to total value added of health services (Chart 6).
Chart 6 : Percentage distribution of gross output and value added by state, 2014
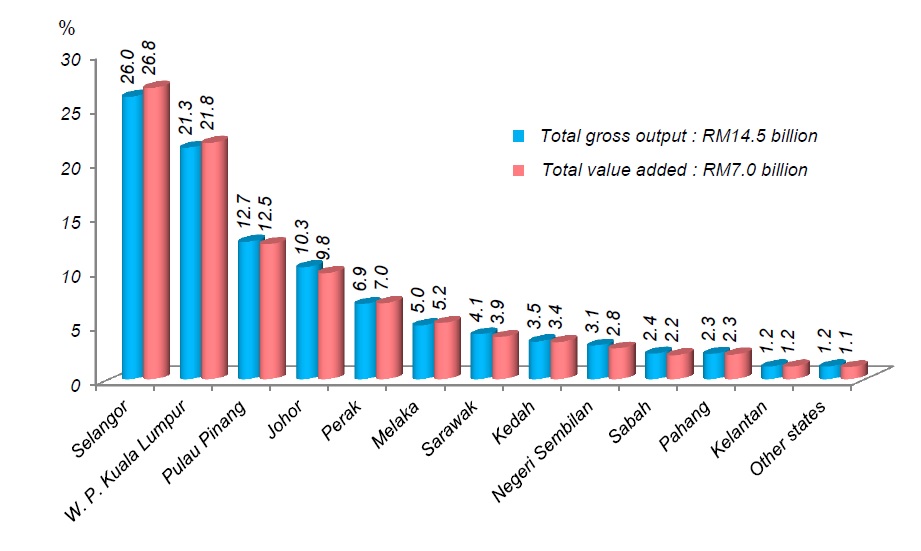
Note:
* Other states consist of Terengganu, Perlis, W.P. Labuan and W.P. Putrajaya
These three states also dominated the total number of persons engaged in this services in 2014 with 52,588 persons (55.0%). The highest number of persons engaged was 24,983 persons (26.1%) in Selangor followed by W.P. Kuala Lumpur of 16,446 persons (17.2%) and Pulau Pinang of 11,159 persons (11.7%). In tandem with the number of persons engaged, Selangor also contributed the highest salaries & wages paid of RM789.3 million (26.7%) followed by W.P. Kuala Lumpur and Pulau Pinang with RM623.4 million (21.1%) and RM389.9 million (13.2%) respectively as in Chart 7.
Chart 7 : Percentage distribution of number of persons engaged and salaries & wages by state, 2014
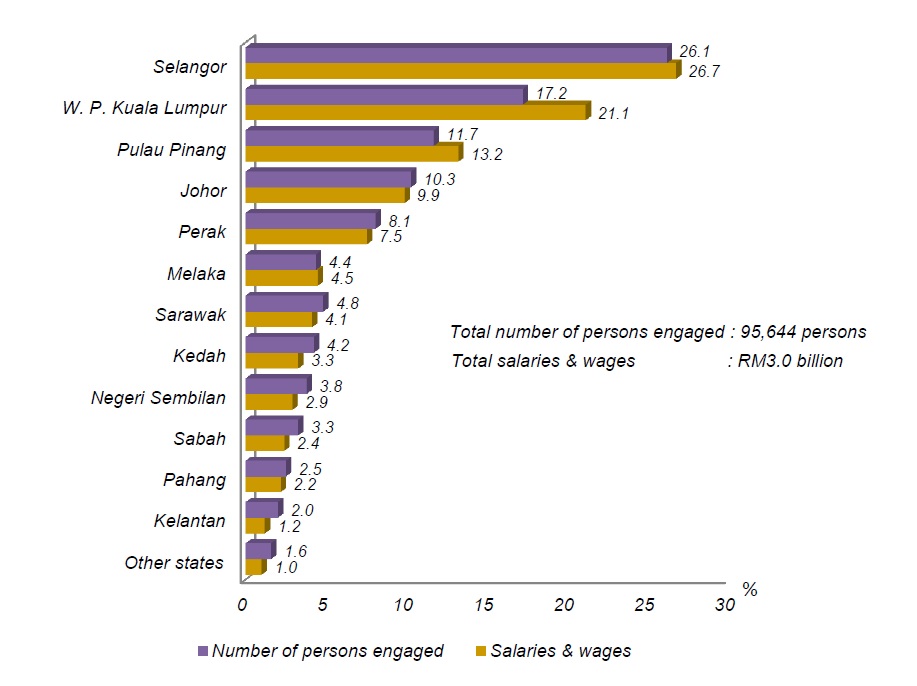
Note:
* Other states consist of Terengganu, Perlis, W.P. Labuan and W.P. Putrajaya
The detailed information regarding this report can be accessed through eStatistik application in the portal of Department of Statistics Malaysia.
Released By:
THE OFFICE OF CHIEF STATISTICIAN MALAYSIA
DEPARTMENT OF STATISTICS, MALAYSIA
30 June 2016
Contact person:
Ho Mei Kei
Public Relation Officer
Corporate and User Services Division
Department of Statistics, Malaysia
Tel : +603-8885 7942
Fax : +603-8888 9248
Email : mkho[at]stats.gov.my
Subscribe
Newsletter
Subscribe to our newsletter and stay updated
For interviews, press statement and clarification to the media, contact:
Baharudin Mohamad
Public Relation Officer
Email: baharudin[at]dosm.gov.my
Phone: 03 8090 4681
Not found what you looking for? Request data from us, through
Go to eStatistik
Email: data[at]dosm.gov.my
Phone: 03 8885 7128 (data request)


